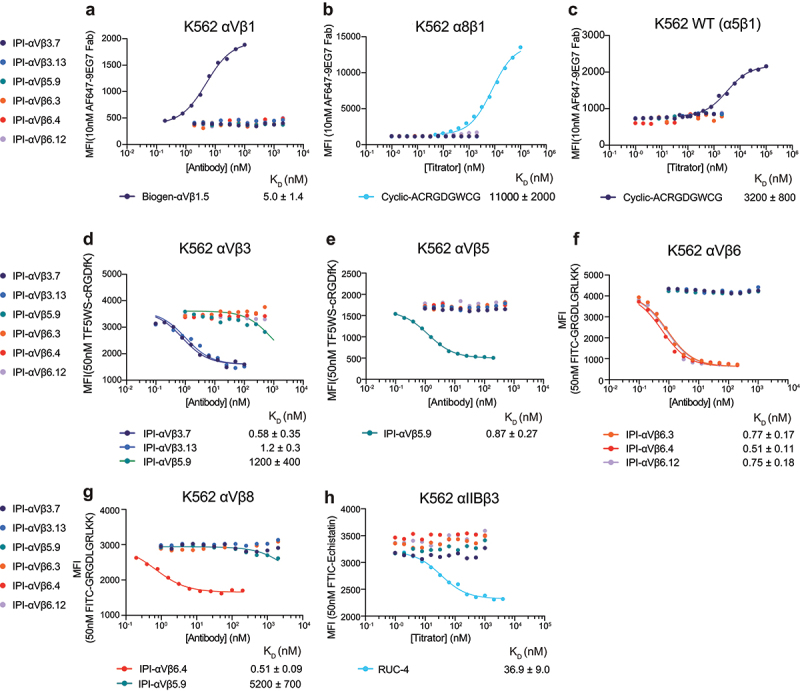
Figure 5.

Binding affinities of RGD-mimetic antibodies for cell surface RGD-binding integrins by flow cytometry without washing. (a-c) Affinities on K562 stable transfectants or WT K562 cells were measured by enhancement of binding of 10nM AF647-9EG7 Fab. Cyclic-ACRGDGWCG and Biogen-αVβ1.5 were included as positive controls. Affinities and standard errors are from nonlinear least square fits of MFI values to a three-parameter dose–response curve. (d-h) Affinities on K562 stable transfectants were measured by competing fluorescently labeled RGD-mimetics. Affinities and standard errors are from nonlinear least square fits of MFI values to a three-parameter dose–response curve fitted individually (αVβ5 and αIIbβ3) or fitted globally (αVβ3, αVβ6 and αVβ8) with the minimum MFI and the maximum MFI as shared fitting parameters and EC50 for each titrator as individual fitting parameters. The KD value of each titrator was calculated from the EC50 value as KD = EC50/(1 + CL/KD,L), where CL is the concentration of the fluorescent peptidomimetic and KD,L is the binding affinity of the fluorescent peptidomimetic to the respective integrin ectodomain as referenced in methods. The errors for the affinities are the difference from the mean from duplicate experiments.
