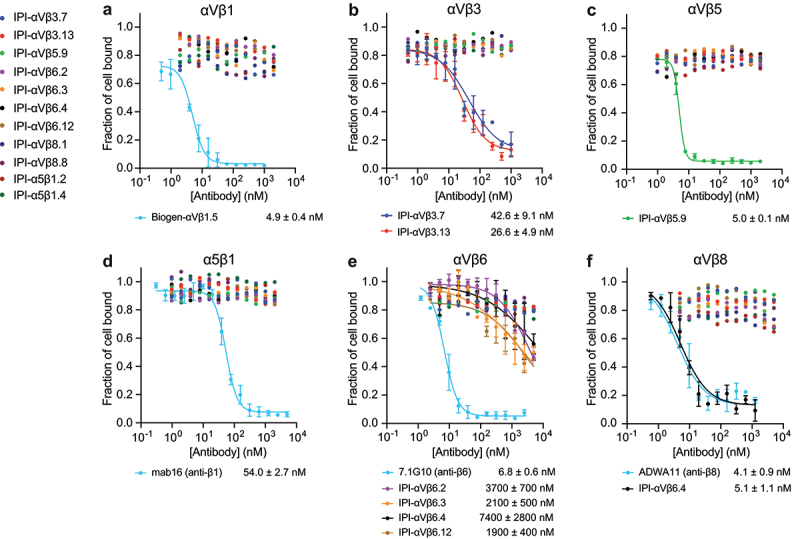
Figure 7.

Inhibition of cell adhesion to ligands on substrates. Expi293 αV−/α5− KO cells transiently transfected with the indicated integrins were mixed with IPI anti-integrin antibodies and assayed for adhesion to ELISA plates coated with 30 nM fibronectin fragment (Fn3 7–12) (a-d) or with 10 nM GARP ectodomain/proTGFβ1 (e-f). After 1 hr at 37°C, the fluorescent intensity of mCherry, which was co-expressed with the transfected β-subunit using a self-cleaving P2A peptide, was recorded before and after washing away nonadherent cells. The fraction of cells bound at each antibody concentration was fitted individually or globally (if more than one antibody was fitted) to a four-parameter dose–response curve, with global fit to shared bottom and top and individual fit to IC50 and hill slope. Values are means and s.d. From triplicate measurements.
