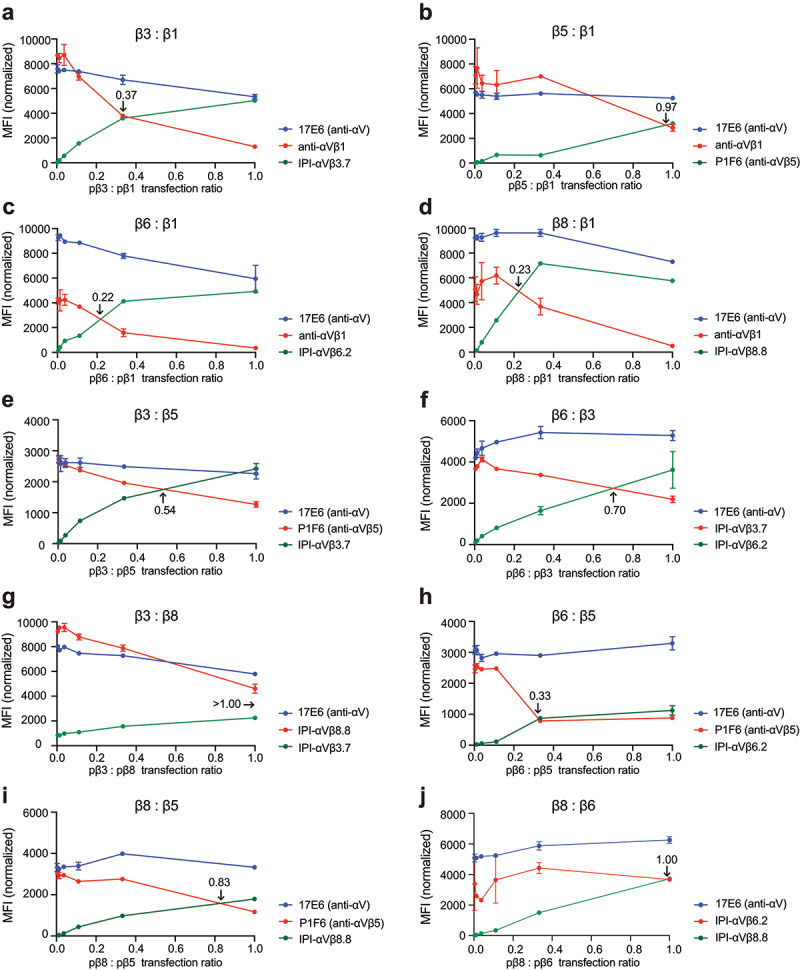
Figure 8.

Competition between integrin β-subunits for the αV-subunit. (a-j.) MFI of directly fluorophore-labeled integrin antibodies measured by flow cytometry. In each competitive titration, the concentration of the αV-subunit plasmid (pαV) and one β-subunit plasmid remained constant at 0.6 µg (red line) while the other β-subunit plasmid (green line) was titrated until reaching 0.6 µg. The αV-subunit plasmid was 0.2 µg in a-e and h-i and 0.6 µg in f-g and j. in all reactions, empty vector plasmid was added to make the total plasmid concentration 1.8 µg. The ratio of the two β subunit plasmids at the cross point is indicated in each panel. The MFI of each β-subunit antibody was normalized relative to the MFI of the 17E6 αV antibody (Supplementary Figure S7).
