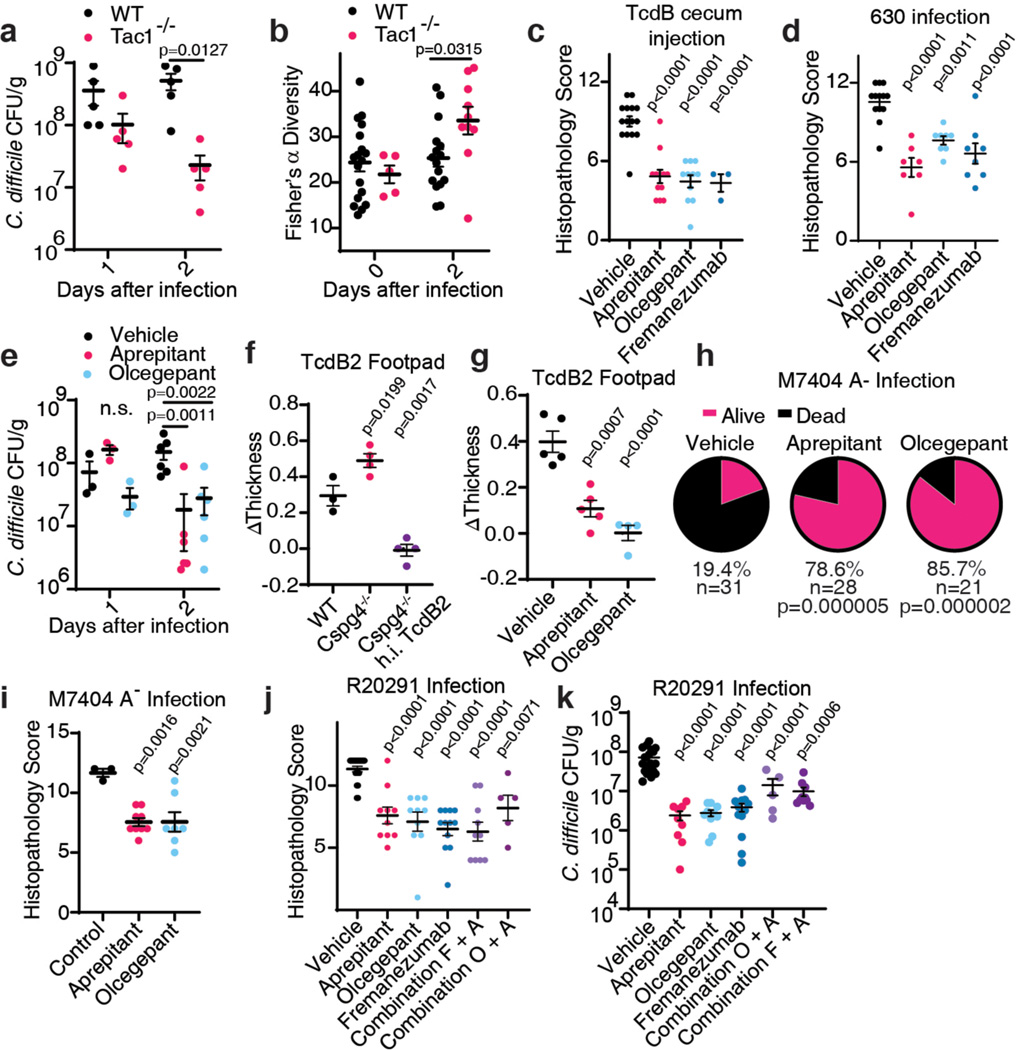
Fig. 4: Inhibiting SP or CGRP signaling alleviates inflammation and reduces C. difficile colonization for endemic and hypervirulent epidemic strains.
a-b, CDI were carried out (630 Δerm strain), and colony forming units (CFUs) of C. difficile in faeces were assessed and plotted in a; n=5, 5 mice. Microbiome diversity was assessed and presented as Fisher’s alpha diversity in b; n=18, 16, 5, 10 mice.
c, Cecum injection assays were carried out with TcdB on mice pretreated with vehicle, aprepitant, olcegepant, or fremanezumab; n=15, 12, 11, 3.
d-e, CDI were carried out (630 Δerm) on mice pretreated with vehicle, aprepitant, olcegepant, or fremanezumab; n=13, 7, 8, 8 mice in d; n=3 (d1) and n=6 (d2) in e.
f-g, TcdB2 induces oedema in WT and Cspg4−/− mice in the footpad injection assay; n=3, 4, 4 mice. Aprepitant and olcegepant can prevent oedema induced by TcdB2. h.i. TcdB2: heat inactivated TcdB2, n=5, 5, 4 mice.
h-i, CDI with the strain M7404 (TcdA-/TcdB2) of mice pre-treated with vehicle, aprepitant, or olcegepant. Survival is plotted in h, n=31, 28, 21. Histological scores are plotted in i, n=3, 9, 7 mice.
j-k, CDI with the hypervirulent strain R20291 of mice pre-treated with the indicated inhibitor (Combination F+A: fremanezumab plus aprepitant; Combination O+A: olcegepant plus aprepitant). Histopathological scores are shown in j, n= 21, 10, 10, 12, 10, 5 mice; CFUs are shown in k, n= 21, 9, 10, 12, 10, 5 mice.
Statistical analyses for a, b, and e: two-way ANOVA, variables are time and genotype/drug treatment, post-hoc Sidak’s test with comparisons by day. For c, d, f, g, i, j and k: one-way ANOVA (<0.0001 overall) with post-hoc Dunnett’s test compared with vehicle (c, d, g, i, j and k). For h, drugs were compared by Fisher’s test to vehicle controls. Centre line: mean; error bars: SEM; n.s., not significant; p values are exact. n is described from left to right.

