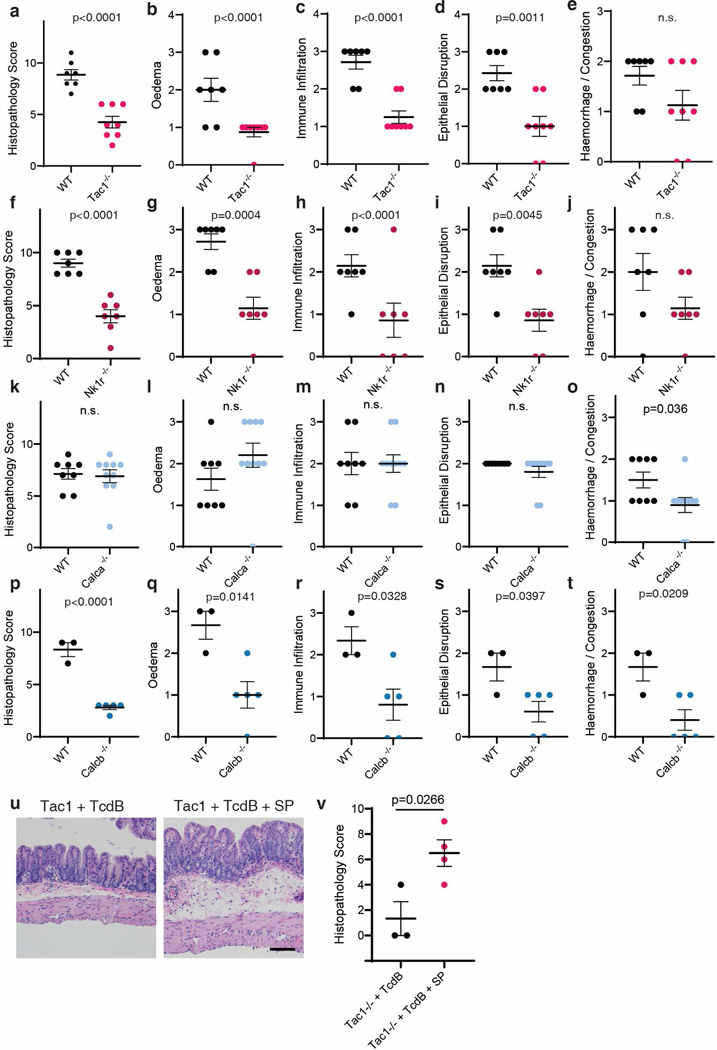
Extended Data Fig. 2: Histological scoring for cecum injections of TcdB in the indicated mouse models as described in Fig. 1c-d.
a-e, Histopathology total scores and subscores of TcdB injected Tac1 KO mice, n = 7, 8 mice.
f-j, Histopathology total scores and subscores of TcdB injected Nk1r KO mice, n = 7, 7 mice.
k-o, Histopathology total scores and subscores of TcdB injected Calca KO mice, n = 8, 10 mice.
p-t, Histopathology total scores and subscores of TcdB injected Calcb KO mice, n = 3, 5 mice.
u, Representative histopathology of Tac1 KO mice injected with TcdB compared to Tac1 KO mice injected with TcdB and SP in the cecal TcdB injection model (120 min incubation).
v, Histopathology scores of experiments described in u, n = 3, 4 mice.
Assessed by Student’s T-test, two tailed, relative to WT control mice. Centre line: mean; error bars: SEM; n.s., not significant, p values are exact. n is described from left to right.

