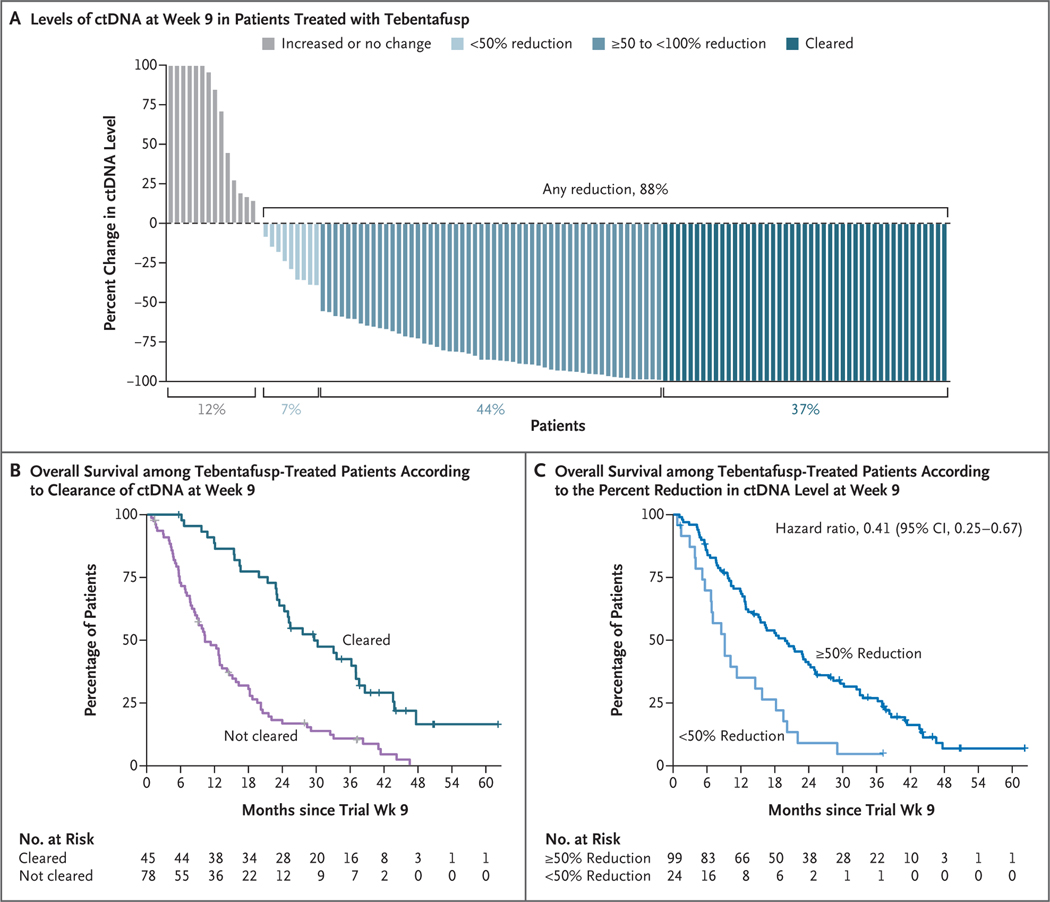
Figure 3. Dynamics of Circulating Tumor DNA and Association with Overall Survival in Patients Treated with Tebentafusp.
Panel A shows a waterfall plot of percent changes in the circulating tumor DNA (ctDNA) level at week 9 during treatment in all 123 tebentafusp-treated patients with evaluable data. Panel B shows Kaplan–Meier estimates of overall survival from week 9 among tebentafusp-treated patients who had ctDNA clearance as compared with those who did not have ctDNA clearance at week 9. Panel C shows K aplan–Meier estimates of overall survival from week 9 among tebentafusp-treated patients who had a reduction of at least 50% in the ctDNA level as compared with those who had a reduction of less than 50%, no change, or an increase at week 9. Tick marks in Panels B and C indicate censored data.

