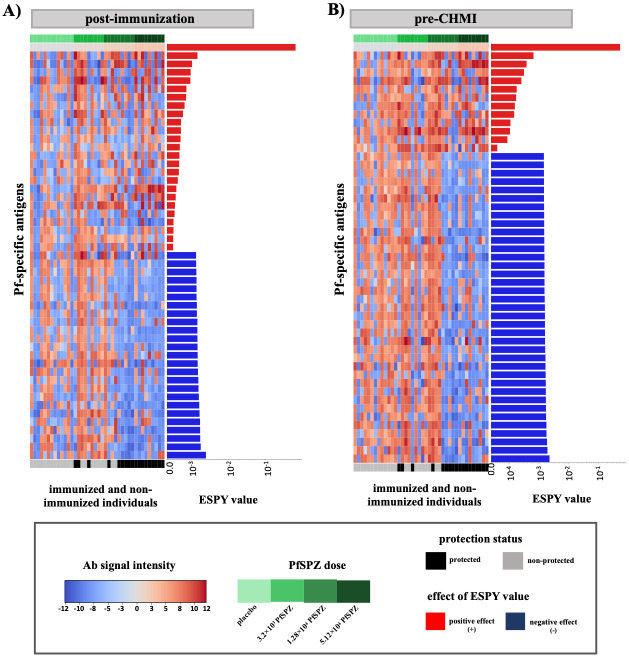
Fig 3. Antibody profile of protected and non-protected vaccinees and the placebo group against informative Pf-specific antigens.
Informative Pf-specific antigens of the complete proteome microarray were evaluated at post-immunization and pre-CHMI. Pf-specific antigens identified to be important by ESPY evaluation showed either a high antibody signal intensity in protected vaccinees or unprotected vaccinees and controls. The top 50 Pf-specific antigens with the highest ESPY values are shown (A) at post-immunization and (B) at pre-CHMI. The heatmap plot shows the antibody signal intensity, while the bars on the right side of each figure show the importance and effect of each feature based on the ESPY value. ESPY values of Pf-specific antigens, that were evaluated to have a positive effect on the protection status classification are colored in red, while blue-colored bars represents antigens, that have a negative effect.

