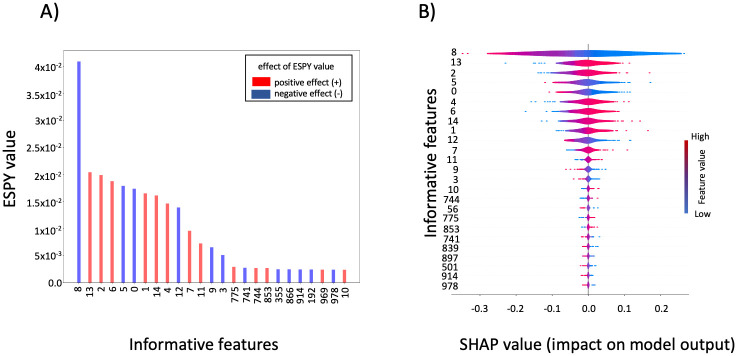
Fig 5. Informative features selected using ESPY and SHAP values on the simulated data.
We show the top 25 features of the simulated data that were evaluated to be informative by ESPY and SHAP. A) The first 14 out of 15 informative features have higher ESPY values in comparison to rest of the features. For each feature the effect with the positive class is indicated by the color of the bars: a negative effect with the positive class (negative ESPY effect) is indicated by blue color and positive effect with the positive class (positive ESPY effect) is indicated by red color. B) Also for the SHAP evaluation, the first 14 out of 15 informative features have the highest mean SHAP values and are thus sorted to the top of the shown violin summary plot. The SHAP value and the color coded original feature value are used to indicate the change of each feature in the model prediction towards the positive or negative class. A high SHAP value indicates a change towards the positive class and vice versa for a low SHAP value.

