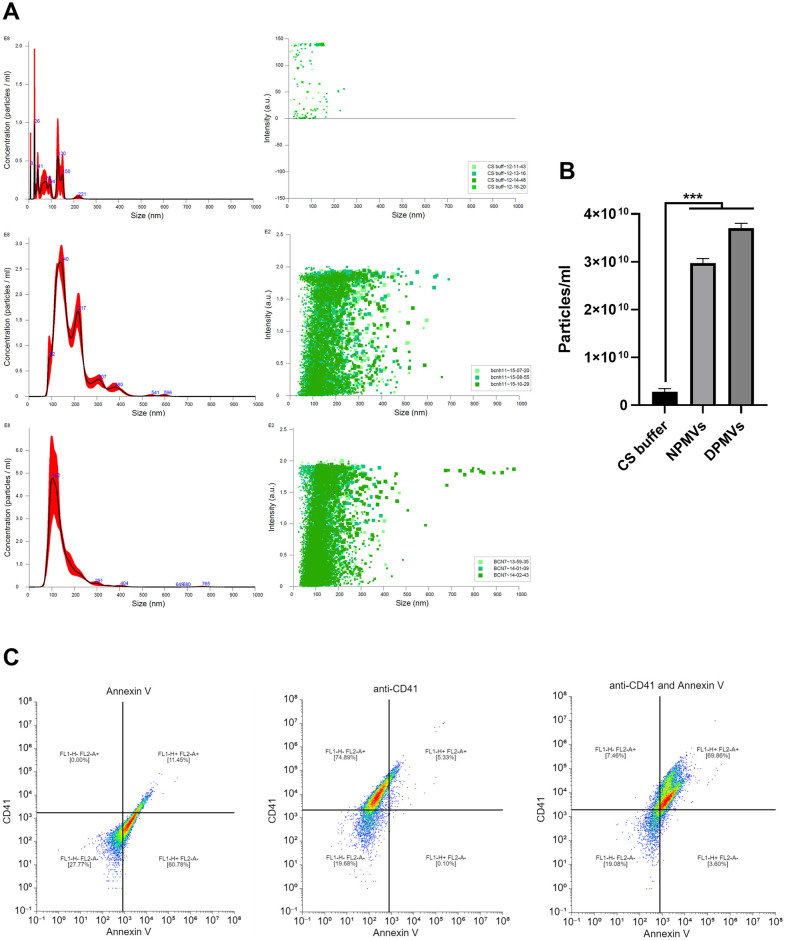
Fig 1. Isolation and characterisation of diabetic PMVs.
(A) Analysis of Tyrode’s buffer, healthy control PMVs (NPMV) and diabetic-patient derived PMVs (DPMV) by NTA. Left panels display particle concentrations (1x10⁸) and size, right panels display individual particle size verses intensity (a.u.), n = 3. (B) PMV particle concentration for Tyrode’s buffer, NPMV and DPMV, n = 3. (C) PMVs were labelled with Annexin V-FITC and/or CD41a-PE, gated around singlets and 10,000 events collected. Example dot plot for single and dual labelled PMVs with quadrant analysis, n = 3. Data are representative of all PMV samples, *** = p<0.001.

