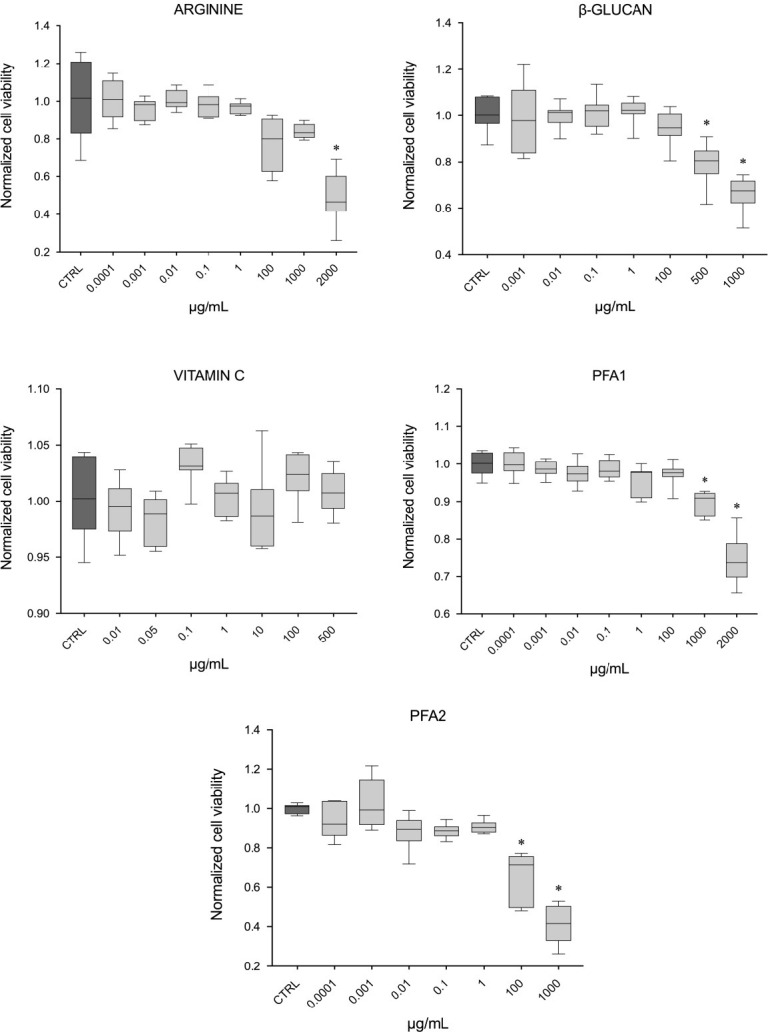
Fig 1. Cell viability.

In vitro cell viability assay, results reported per ingredient: (A) arginine, (B) β-glucan, (C) vitamin C, (D) phytogenic feed additive 1, (E) phytogenic feed additive 2. Values are expressed as μg/mL and reported as median ± standard deviation, normalized to the control (CTRL); (n = 7), * = p < 0.05 (compared to the control).
