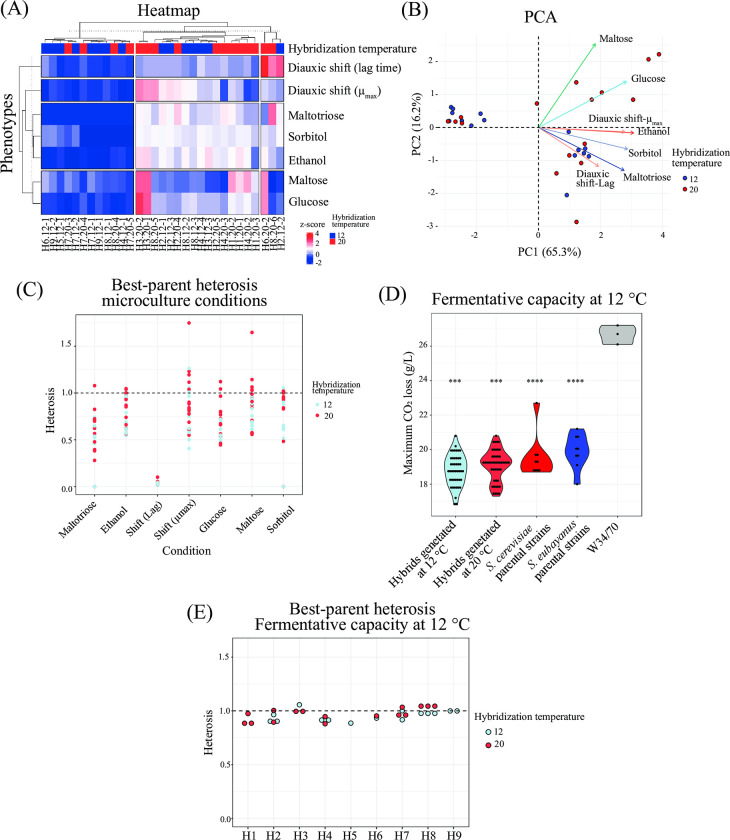
Fig 1. Phenotypic characterization of interspecific F1 hybrids.
A) Hierarchically clustered heatmap of phenotypic diversity of 31 interspecific hybrid strains under microculture conditions. Phenotypic values are calculated as normalized z-scores. For the diauxic shift between glucose and maltose, lag time and μmax were determined during growth in maltose. (B) Principal component analysis (PCA) using the maximum specific growth rates under six microculture growth conditions, together with the distribution of hybrid strains. Arrows depict the different environmental conditions. (C) Best-parent heterosis in the 31 interspecific hybrids evaluated under microculture conditions in triplicates. (D) Fermentation capacity for the 31 interspecific hybrids and parental strains at 12°C. Plotted values correspond to mean values of three independent replicates for each hybrid. Asterisk indicates different levels of significance compared to the commercial strain W34/70 (Student t-test; *** p≤ 0.001 and **** p≤ 0.0001). (E) Best-parent heterosis in the 31 interspecific hybrids evaluated under fermentation conditions at 12°C.

