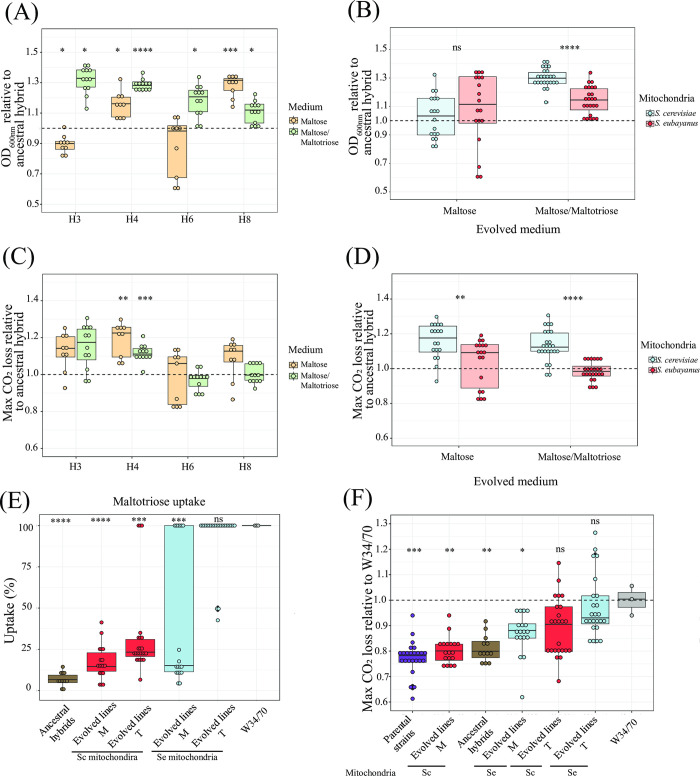
Fig 2. Fitness of evolved lines under microcultures and fermentation conditions.
(A) Mean relative fitness (maximum OD600nm) of evolved lines after 250 generations to their respective ancestral hybrids under microculture conditions. Evolved lines were evaluated in the same medium where they were evolved (M or T medium). (B) Comparison of mean relative fitness (maximum OD600nm) shown in (A) between evolved lines from hybrids with S. eubayanus (Se) and S. cerevisiae (Sc) mitochondria. (C) Mean relative fitness (maximum CO2 loss) of evolved lines after 250 generations to their respective ancestral hybrids under fermentation conditions at 12°C. (D) Comparison of mean relative fitness (maximum CO2 loss) shown in (C) between evolved lines from hybrids with S. eubayanus and S. cerevisiae mitochondria. (E) Maltotriose uptake of evolved hybrid lines in maltose (M) and maltose/maltotriose (T), relative to the commercial lager strain W34/70. Ancestral hybrids are shown in grey, and hybrid lines with S. eubayanus and S. cerevisiae mitochondria are shown in blue and red, respectively. (F) The fermentative capacity of evolved individuals relative to the commercial lager strain W34/70 grouped according to the environmental condition used during experimental evolution and inherited mitochondria. Plotted values correspond to the mean of three independent biological replicates of each evolved line or strain. Asterisk indicates significant statistical differences between evolved lines and their respective ancestral hybrids in (A) and (C), between evolved lines with different inherited mitochondria in (B) and (D), and between evolved lines and the commercial lager strain in (E) and (F). Purple depicts Parental strains, brown the ancestral hybrid, and red and blue the Sc and Se evolved lines carrying mitochondria, respectively. Asterisk represents different levels of significance (Students t-test, * p ≤ 0.05, ** p ≤ 0.01, *** p ≤ 0.001, **** p ≤ 0.0001, ns not significant).

