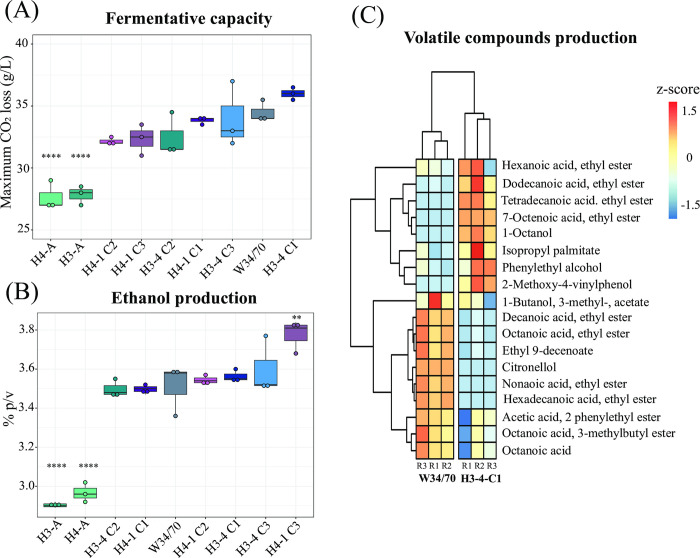
Fig 3. Fermentation performance of evolved hybrid individuals.
(A) Maximum CO2 loss (g/L) for three different isolated genotypes (C1-C3) from evolved lines H3-4 and H4-1, ancestral hybrids (H3-A and H4-A) and commercial lager strain (W34/70). (B) Ethanol production (% v/v) for strains evaluated in (A). (C) Hierarchically clustered heatmap of volatile compounds production for strains evaluated in (A). Phenotypic values are calculated as normalized z-scores. For (A) and (B), plotted values correspond to the mean of three independent replicates. The (*) represents different levels of significance between hybrids and commercial lager strains (Student t-test, ** p < 0.01, **** p < 0.0001).

