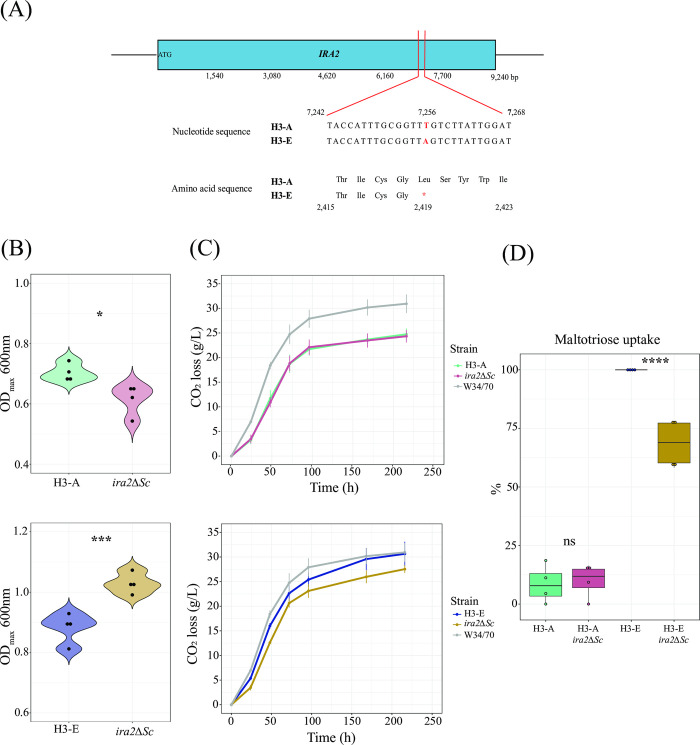
Fig 4. Genomic analysis of evolved hybrids.
(A) SNP present in the IRA2 gene in the S. cerevisiae subgenome in the H3-E hybrid. (B) Maximum OD600nm of ira2ΔSc mutant strains under microculture conditions. Mutant and wild-type strains were evaluated in the T medium. (C) CO2 loss kinetics for ira2ΔSc mutant and wild-type strains. (D) Maltotriose uptake (%) for strains evaluated in (C). For (B), (C), and (D), plotted values correspond to the mean of four independent replicates. The (*) represents different levels of significance between mutant and wild-type strains (Student t-test, * p < 0.05, *** p < 0.001, **** p < 0.0001).

