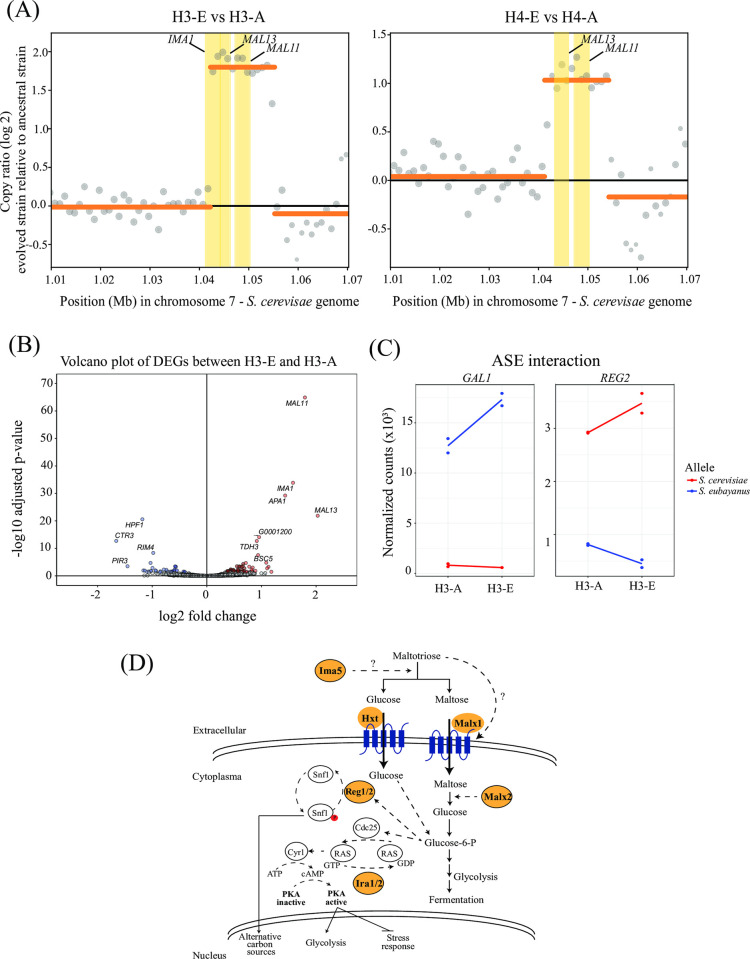
Fig 5. Copy number variation and differential gene expression analysis.
(A) Copy number variations (CNVs) between H3-E and H4-E hybrids relative to their ancestral hybrids found in S. cerevisiae chromosome 7. Coding genes located within bins showing CNV calls higher than 1 copy (yellow rectangles) are shown. (B) Volcano plot showing differential expressed genes (DEGs) between H3-E and H3-A hybrids. The red and blue dots represent up-regulated and down-regulated genes in the H3-E hybrids, respectively. (C) Orthologous genes showing an interaction between allelic expression and experimental evolution. (D) Model depicting genes exhibiting mutations after the experimental evolution assay (highlighted in orange) and involved in pathways related to the detection, regulation, uptake, and catabolism of maltotriose. Phosphorylation is indicated in red. In blue highlight transporters involved in sugar consumption.

