
Figure 3.
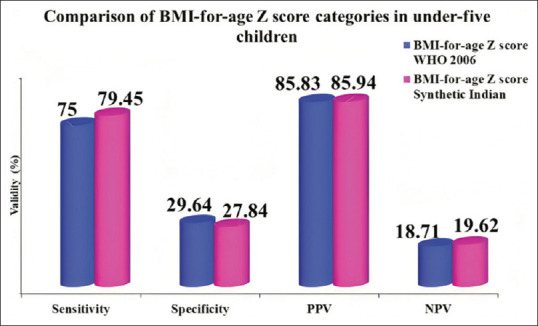
Sensitivity, specificity, positive predictive value (PPV) and negative predictive value (NPV) for BMI-for-age Z-scores on WHO 2006 and synthetic Indian charts against disease status
Official websites use .gov
A
.gov website belongs to an official
government organization in the United States.
Secure .gov websites use HTTPS
A lock (
) or https:// means you've safely
connected to the .gov website. Share sensitive
information only on official, secure websites.
Sensitivity, specificity, positive predictive value (PPV) and negative predictive value (NPV) for BMI-for-age Z-scores on WHO 2006 and synthetic Indian charts against disease status