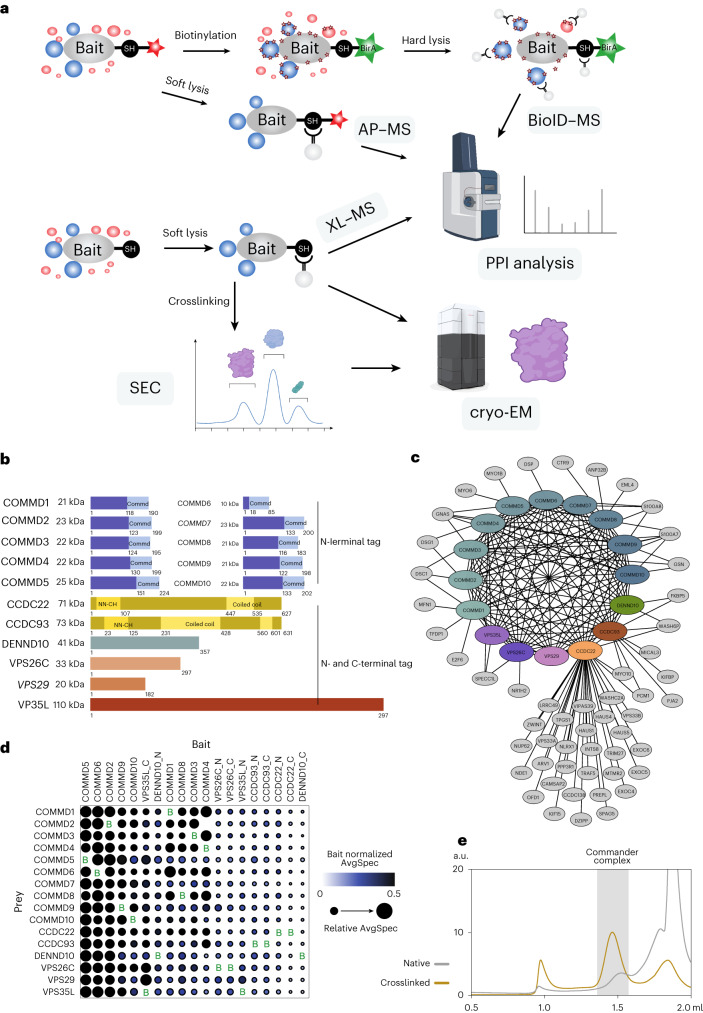
Fig. 1. Purification and analysis of the endogenous Commander complex.
a, Schematic of the study design using AP–MS, proximity-dependent BioID–MS, crosslinking (XL)–MS, size-exclusion chromatography (SEC) and cryo-EM. b, The known 16 members of the Commander complex proteins, their molecular weights (in kDa) and known domain compositions. The 14 complex proteins used as baits in the studies are shown in a normal, roman typeface. c, High-confidence and stable Commander complex interactome identified by AP–MS analysis. d, Stoichiometry analysis of N- or C-terminally tagged Commander complex components identified with AP–MS. The color of each circle represents the abundance of each prey normalized to the mean abundance of the bait, and the circle radius indicates the relative abundance across all samples. e, Size-exclusion chromatography of the purified Commander complex with or without crosslinking. The peak indicated in gray background was used for cryo-EM analysis. a.u., arbitrary units.

