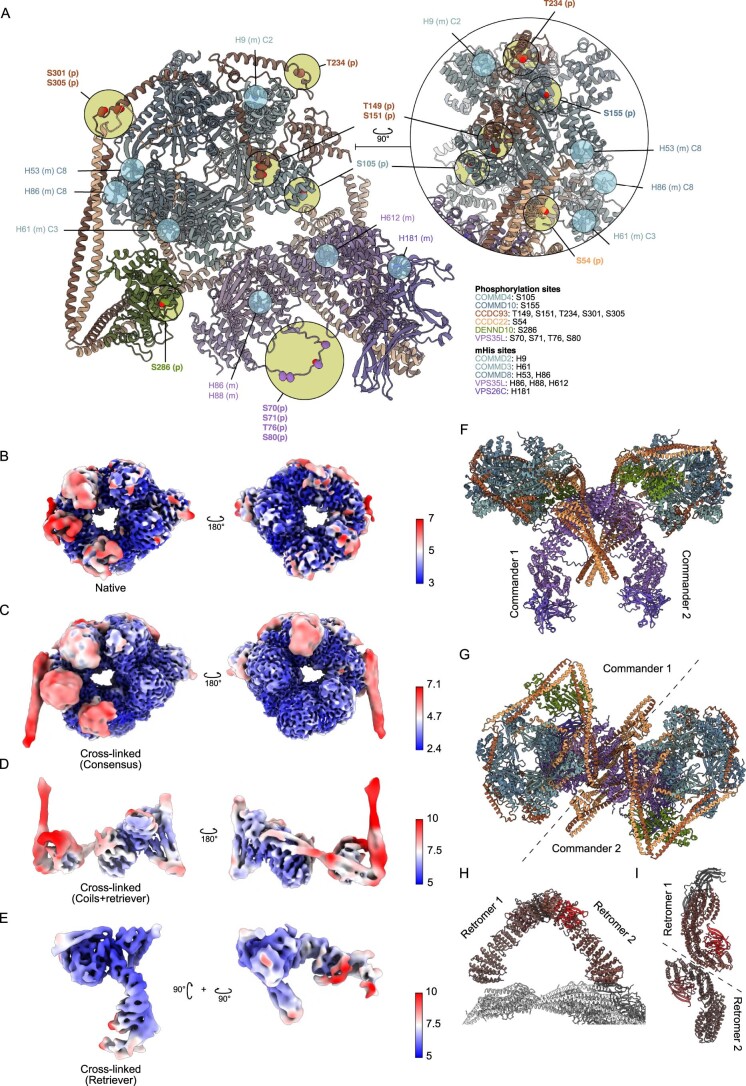
Extended Data Fig. 5. Detected post-translational modifications, local resolution estimates and putative dimerization mode of Commander complex, related to Figs. 1, 3, and 4.
a, Molecular model of Commander complex with all detected phosphorylation and histidine methylation sites. m: met-His site, p: phosphorylation site. Inset: rotated model showing details on the CCDC93 NN-CH domain side of the complex. b-e, Local resolution estimates of cryo-EM maps from b native Commander, c crosslinked Commander consensus map d crosslinked Commander focused map 1 (Coils) and e crosslinked Commander focused map 2 (Retriever). Color bar indicates resolution in Å. f, Model of putative head-to-head dimerization of Commander complex prepared by superposition via VPS29 and VPS35(L) C-terminal region. g, Top view of the model in f. h, Retromer arch model (PDB ID 6H7W) depicted in the same orientation as Commander dimer model in f. i, Top view of the model in h. Models in h-i color-coded as in Extended Data Fig. 4f.

