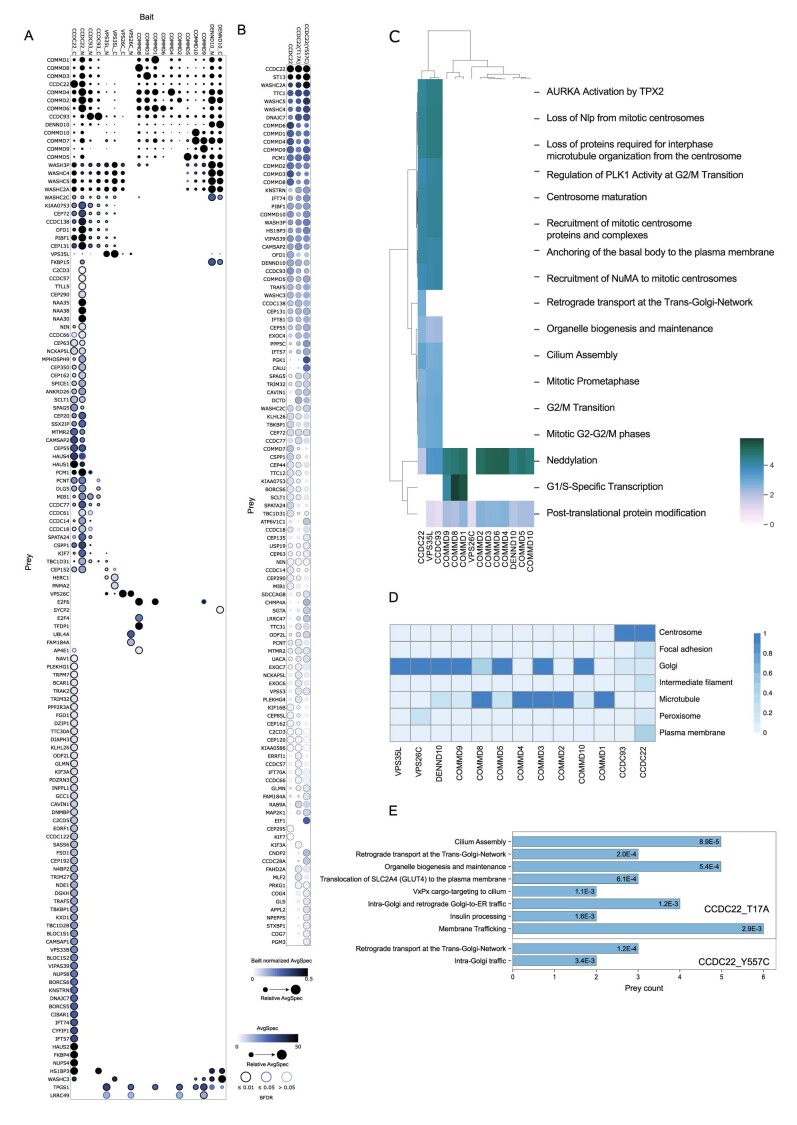
Extended Data Fig. 7. Molecular interactors, context, and cellular pathways connected with individual Commander complex components, related to Fig. 6.
a, Dot-plot visualization (BFDR ≤ 0.05) of interactors of the Commander complex detected by the BioID-MS. Node color corresponds to the abundance of the average spectral count for each prey, and node radius to its relative abundance. b, Dot-plot visualization of RSS syndrome related point mutants of CCDC22 analyzed by BioID-MS. All PPIs passing HCI criteria to any of the CCDC22 variants are plotted, with HCIs are indicated with black outline and non-HCIs with light blue. Node color corresponds to the bait normalized abundance of the average spectral count for each prey, and node radius to its relative abundance across all baits determined by ProHits-Viz. c, Reactome pathways enriched for the Commander complex proteins. d, Molecular level localization of the Commander complex proteins obtained by MS-microscopy. e, Reactome pathways enriched (p < 0.005, values marked in bars) for the RSS disease variant HCIs distinct from the wild-type CCDC22.

