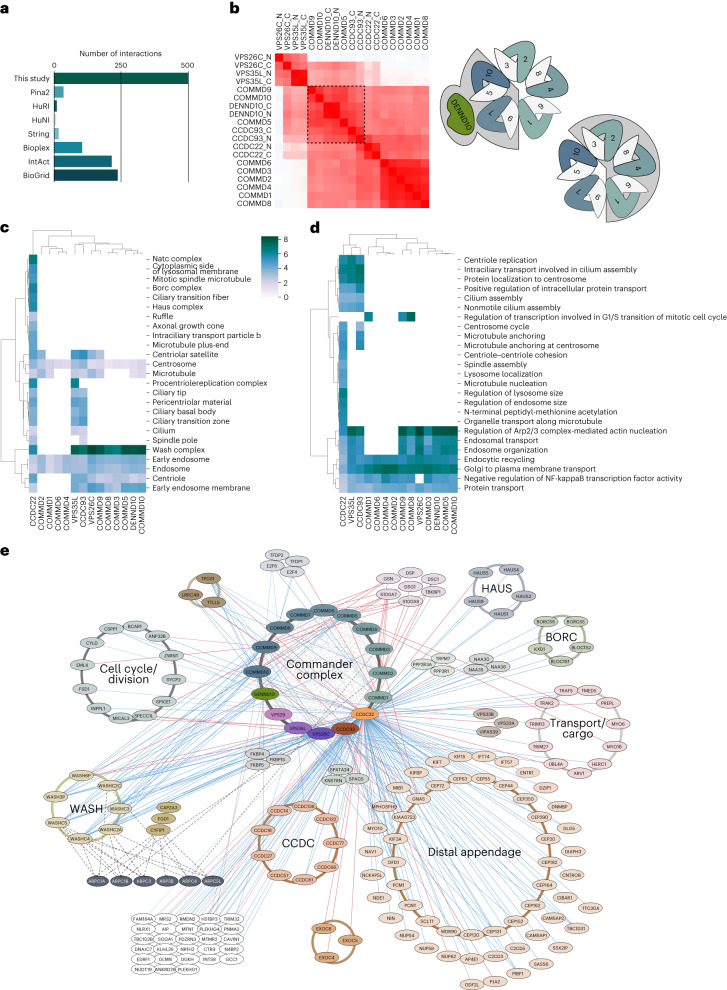
Fig. 6. Molecular context, cellular interactions and functions of the Commander complex.
a, Comparison of high-confidence Commander complex interactions (from BioID–MS) to interactions in databases. b, Bait–bait clustering of BioID interactions of Commander proteins reveals two distinct clusters suggesting two different subcomplexes. c,d, GO-CC (c) and GO-BP (d) term analysis and clustering based on Commander complex BioID interactions. e, Complete map of the molecular interactions formed by the Commander complex. The key shows the Commander complex components used as baits color coded as in Fig. 1, identified interactions with AP–MS and BioID are shown as red and blue edges, respectively. Reciprocal interactome analysis with ARP proteins is shown in the lower right corner. Interacting proteins are organized to designated protein complexes (CORUM; with brown to light orange-colored circles), and based on their function (light gray circles). The nodes linked to cilium assembly (based on GO-BP) are shown with a light orange node color.

