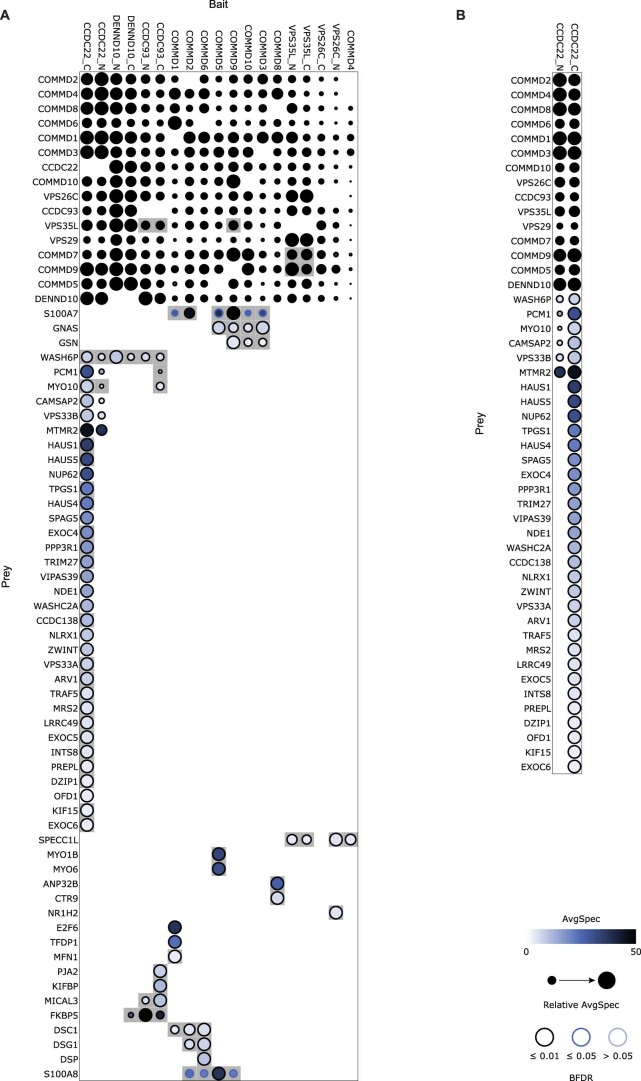
Extended Data Fig. 1. Affinity purification mass spectrometry analysis of Commander components, related to Fig. 1.
a, Dot-plot visualization (BFDR ≤ 0.05) of the Commander complex proteins’ interactors detected by the AP-MS. Each node corresponds to the abundance of the average spectral count for each prey, and the node size relative abundance of the prey. BFDR values are indicated with circles around the node, and previously uncharacterized interactions are highlighted with gray background. b, Focused Dot-plot visualization of the CCDC22 interactions. Commander complex components, WASH complex components, and proteins involved in WASH complex recruitment are indicated in bold typeface.

