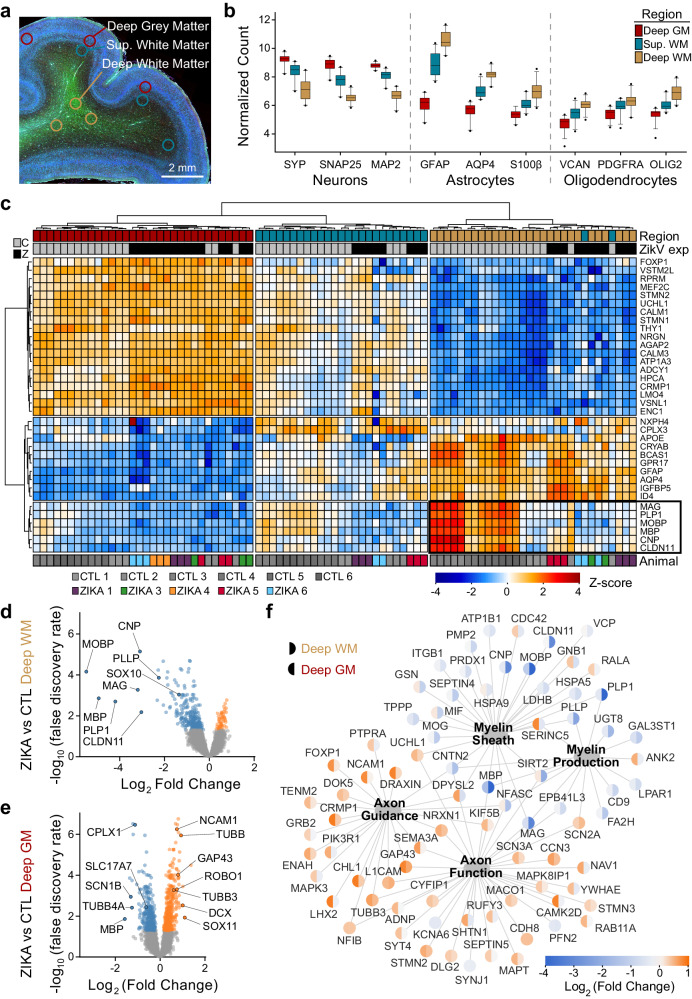
Fig. 1. Fetal ZikV exposure causes downregulation of myelination genes in deep white matter of nonhuman primate.
Digital spatial profiling (DSP) of tissue from control (n = 6) and ZikV (n = 6) animals was conducted using the Nanostring GeoMx DSP platform, after immunofluorescence staining to identify regions of brain and cell types. Samples from ZIKA 2 did not meet quality control metrics for downstream analysis. a ROIs were selected in triplicate for each brain, representing DGM (red), SWM (teal), and DWM (tan). b Box and whisker plots (box = 25th–75th percentile and median, whiskers = 5th–95th percentile) representing normalized counts for selected genes classically expressed by neurons (left), astrocytes (center), and oligodendrocytes (right), according to ROI. Data for graphs are provided in Source Data file. c Normalized gene expression (row-specific Z-score) of the top 35 differentially expressed (DE) genes identified in pair-wise comparison of samples across ROI and ZikV exposure. Samples (x-axis) and genes (y-axis) were clustered by calculating Euclidean distances using Ward.D2. Top row, color coding by ROI, as in (b). Second row, color coding by exposure: grey, control; black, ZikV. Bottom row: color coding by animal. Black outline highlights genes enriched in DWM that relate to myelination. d, e Volcano plots of DE genes comparing ZikV to control animals for ROIs representing (d) DWM and (e) DGM. Orange, significantly (FDR < 0.05) upregulated in ZikV; blue, significantly downregulated in ZikV; grey, FDR > 0.05 in DE comparison. f Network of 79 DE genes (FDR < 0.05) in either DWM or DGM clustered by gene ontology (GO, large nodes) representing axon function (GO:0030424 and GO:0007411) and myelination (GO:0042552 and GO:0043209). GO terms were selected by applying over-representation analysis (ORA) to DE genes in each cluster (Fig. S2a). Small nodes represent average log-fold change (color) for each gene in DWM (left half) and DGM (right half). Average gestational age (±SD) of ZikV-exposed vs CTL animals in DSP analysis = 150(±9) vs 156(±2) days; p = 0.14 by t test for DGM; 154(±8) vs 156(±2) days; p = 0.46 by t test for DWM. Source data are provided as a Source Data file.

