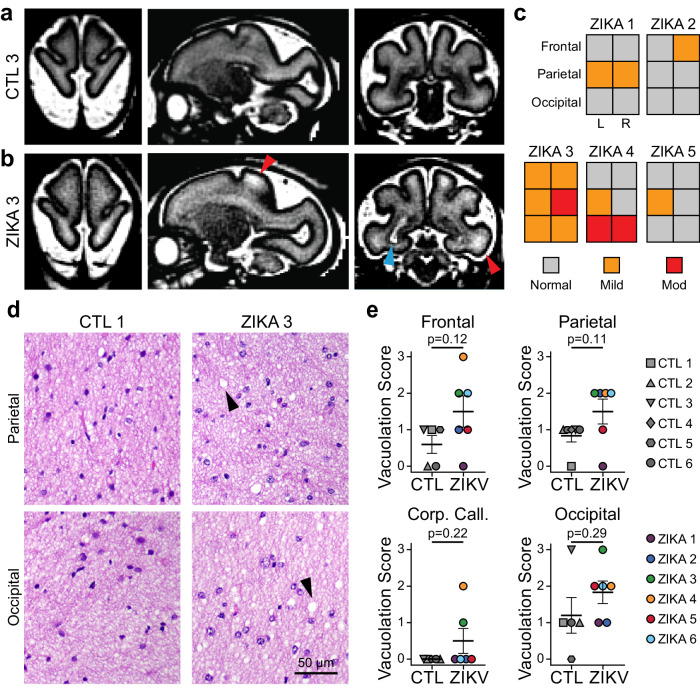
Fig. 3. Spatial heterogeneity of pathology in ZikV-exposed fetal NHP brain.
a, b Representative T2-weighted MRI images (left, axial; middle, sagittal; right, coronal) for (a) control and (b) ZikV animals. MRI scans were collected at GD125 for CTL3 and GD120 for ZIKA3 (Fig. S1). Blue arrowhead indicates the primary periventricular lesion described previously31. Red arrowheads indicate T2-weighted (T2W) hyperintense foci in subcortical white matter, which can be seen in delayed, abnormal, or inflamed myelin. c Ordinal scale of T2W intensity identified in the frontal, parietal and occipital lobes of Zika-exposed animals. Relative scale was established with normal appearance matching control animals and severe signal abnormality matching the T2W signal of the primary lesion. d Representative hematoxylin and eosin (H&E) images of white matter at the level of parietal lobe (top) and occipital lobe (bottom) for control (left) and ZikV animals (right). Arrowheads indicate areas of vacuolization seen in the H&E staining of white matter. e plots representing semi-quantitative scoring of white matter vacuolar changes (concordance of two blinded evaluators; n = 6 CTL and 6 ZikV animals) performed on H&E staining of deep white matter from frontal, parietal, and occipital brain regions as well as corpus callosum. Vacuolar changes were scored from 0–3 using an ordinal system; grade 0 indicated normal tissue and grade 3 indicated moderate vacuolation over at least 2/3 of the tissue area. Data for graphs are provided as a Source Data file. Error bars, mean ± SEM. Source data are provided as a Source Data file.

