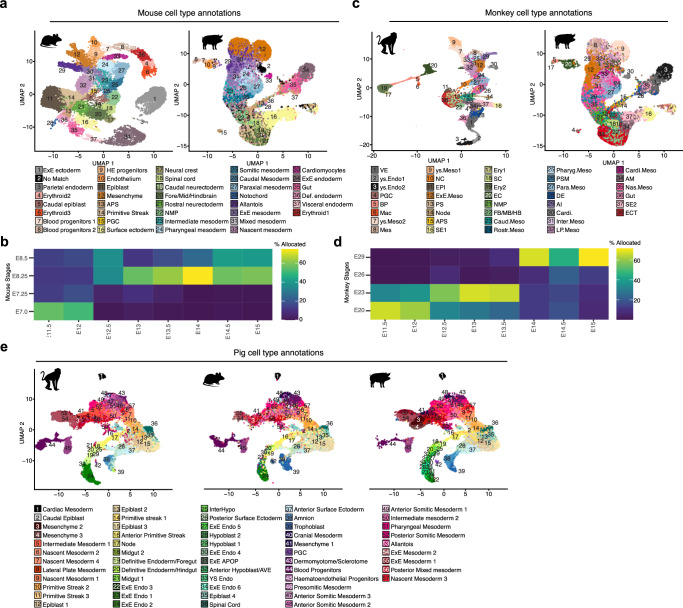
Fig. 2. Alignment of Pig, Mouse and Monkey datasets.
a UMAPs showing E6.5–8.5 mouse embryo cell types2 and Pig E11.5 to E15 with mouse annotations after reciprocal PCA-based projection onto the mouse dataset. b Heat map showing the percentage of pig cells in each stage allocated to a particular mouse stage after label transfer. E Embryonic day. c UMAPs showing E20-29 monkey embryo cell types6 and Pig E11.5 to E15 with mouse annotations after reciprocal PCA-based projection onto the monkey dataset. d Heat map showing the percentage of pig cells in each stage allocated to a particular monkey stage after label transfer. A percentage of 100 would indicate that all cells of a given cell type were predicted to be analogous to the cell identity in the queried organism. e UMAPs showing the aligned monkey, mouse and pig datasets with pig cell type and subtype annotations.

