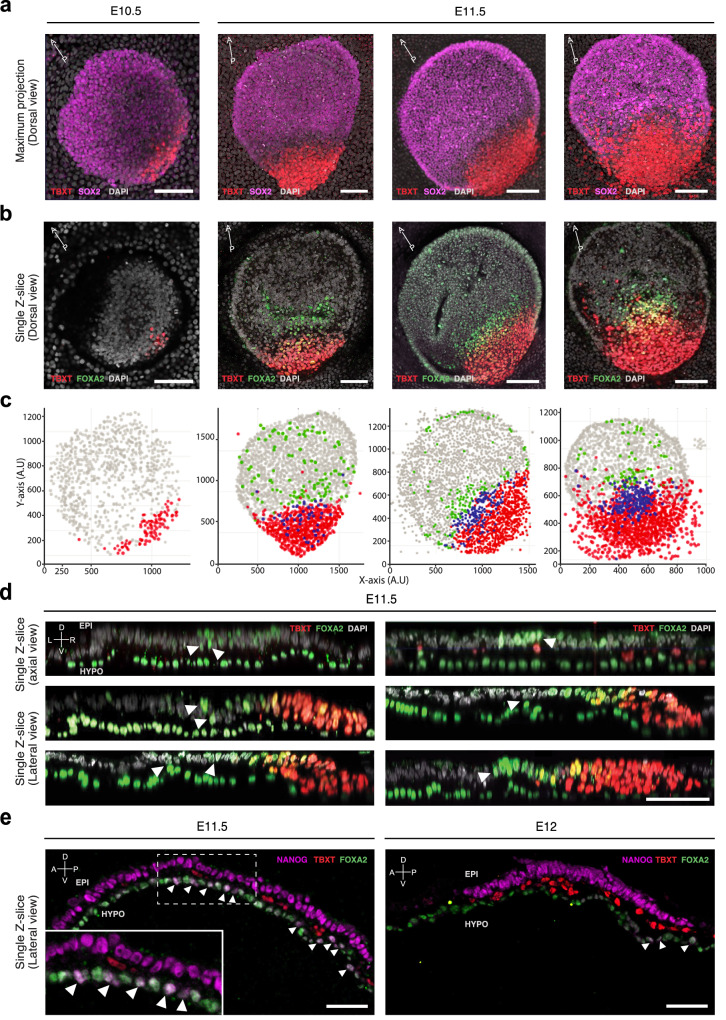
Fig. 6. FOXA2 and TBXT domains are spatially separated.
a Maximum intensity projection (Dorsal view) of E10.5 (n = 1) to E11.5 (n = 4) porcine embryos showing TBXT and SOX2 expression. E11.5 embryos are ordered left to right by age. E Embryonic day. b Single z-slice of the embryos shown in a showing FOXA2 and TBXT expression. Scale bar: 50 µm. c In Silico representations of embryos following 3D segmentation of embryos from a and b. d Axial and lateral reconstructed sections of embryos stained for FOXA2 and TBXT. Epiblast layer is oriented above the hypoblast/DE layer. White arrowheads indicate FOXA2 + TBXT- cells that are spatially separated from the TBXT domain. Scale bar: 50 µm. e Lateral sections of E11.5 (n = 1) and E12 (n = 1) embryos, showing expression of NANOG, FOXA2 and TBXT. Epiblast layer is oriented above the hypoblast/DE layer. White arrowheads indicate NANOG+ cells. Scale bar: 50 µm. Please refer to Supplementary Fig. 21 for a colour blind friendly version of the figure.

