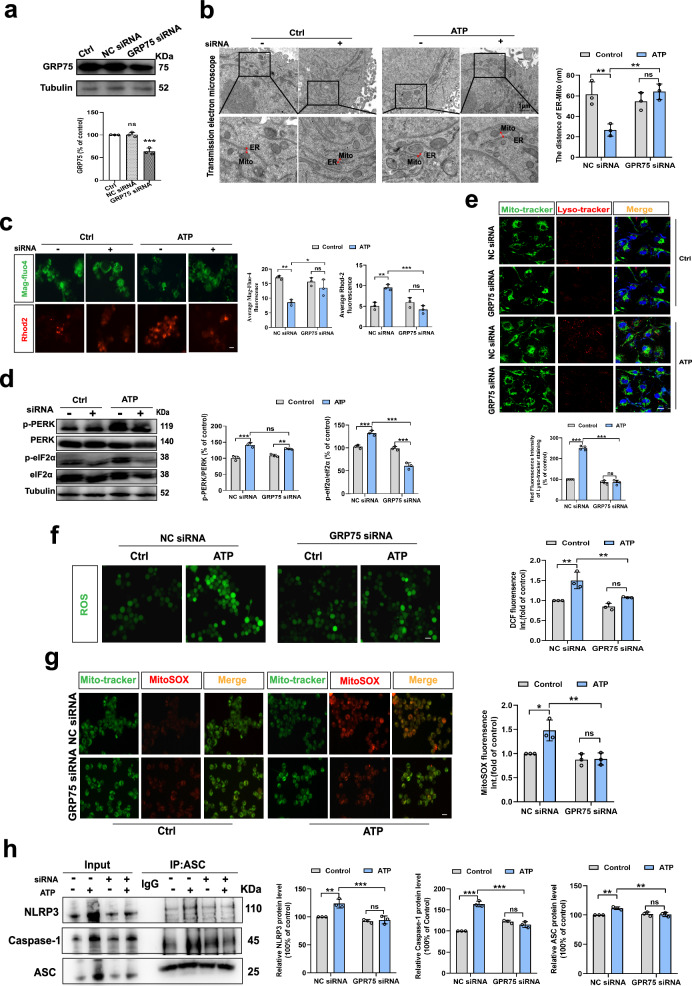
Fig. 3. IP3R3-GRP75-VDAC1 complex participates in the changes in MAMs structure and function induced by eATP.
a Western blot analysis of GRP75 proteins expression in BV2 cells subjected to transfection of GRP75 siRNA or negative control (NC) siRNA (n = 3 batches of transfected cell samples; P = 0.9897; P = 0.0003). b Representative TEM images of ER-mitochondria contact (left panel) and the quantitative analysis of the distance (right panel, n = 3 mitochondria in 3 fields per condition; Interaction, F (1, 8) = 19.14, P = 0.0024). Scale bar: 1 μm. c Representative fluorescence images (left panel) and quantitative analysis (right panel, n = 3 per condition; Interaction, F (1, 8) = 11.11, P = 0.0103; Interaction, F (1, 8) = 33.60, P = 0.0004) of Mag-Fluo-4 and Rhod-2 in BV2 cells. Scale bar: 20 μm. d Western blot analysis of PERK and elf2α phosphorylation proteins (n = 3 batches of transfected cell samples; Interaction, F (1, 8) = 10.79, P = 0.0111; Interaction, F (1, 8) = 124.7, P < 0.0001). e Representative confocal images (above panel) of the intracellular localization of lysosome (Lyso-Tracker, red), mitochondria (Mito-Tracker, green) and nucleus (Hoechst, blue) in BV2 cells and the statistical analysis (below panel, n = 4; Interaction, F (1, 8) = 77.58, P < 0.0001) of the fluorescence intensity. Scale bar: 20 μm. f Representative photographs of DCF fluorescence (left panel) and Relative DCF fluorescence was quantitatively analyzed (right panel, n = 3; Interaction, F (1, 8) = 4.353, P = 0.0704). Scale bar: 20 μm. g Representative images of MitoSOX (red) and Mito-tracker (green) fluorescence in BV2 cells (left panel). And relative MitoSOX fluorescence was quantitatively analyzed (right panel, Interaction, F (1, 8) = 8.536, P = 0.0192). Scale bar: 20 μm. h Representative blots of co-immunoprecipitation (IP, left panel) and quantification of the NLRP3, Caspase-1 and ASC protein changes (n = 3 batches of transfected cell samples; Interaction, F (1, 8) = 11.48, P = 0.0095; Interaction, F (1, 8) = 140.9, P < 0.0001; Interaction, F (1, 8) = 14.41, P = 0.0053). One-way or Two-way ANOVA with Tukey’s multiple comparisons test. Data are expressed as mean ± SEM. ns, p > 0.05, *p < 0.05, **p < 0.01, ***p < 0.001. Source data are provided as a Source Data file.

