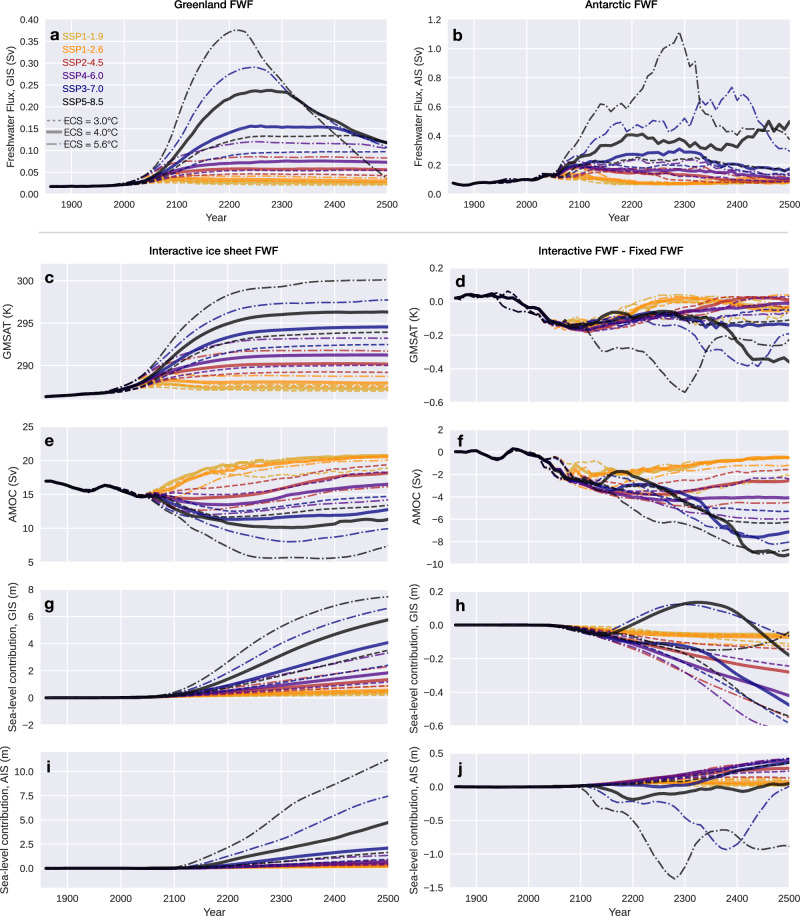
Fig. 1. Time series of selected variables simulated by the coupled ice sheet-climate model in a variety of scenarios.
a Freshwater flux (FWF) from the Greenland Ice Sheet (GIS) in the FWAG configuration (FWF of both ice sheets interacts with the climate). b Same as (a) but for the Antarctic Ice Sheet (AIS). c, e, g, i Results from the FWAG configuration. d, f, h, j Difference in results between the FWAG and the FWC (constant ice sheet FWF) configurations, showing the effects of interactive ice sheet FWF. Atmospheric CO2 concentration is specified according to the historical (1850–2014) and six SSP scenarios (2015–2500), which are color-coded. Simulations with ECS of 3.0 °C, 4.0 °C, and 5.6 °C are shown in dashed, solid, and dash-dot lines, respectively.

