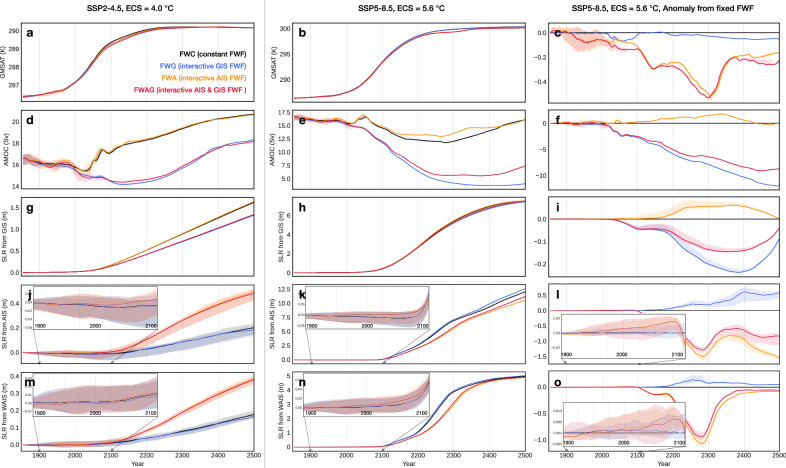
Fig. 2. Time series of selected variables from 10-member ensemble simulations with the coupled ice sheet-climate model in two CO2 scenarios and four freshwater flux (FWF) configurations.
Top to bottom rows show global-mean surface air temperature (GMSAT, a–c), intensity of the Atlantic Meridional Overturning Circulation (AMOC, d–f), sea level rise (SLR) contributed by the Greenland Ice Sheet (GIS) (g–i), by the Antarctic Ice Sheet (AIS) (j–l), and by the West Antarctic Ice Sheet (WAIS) (m–o). Left column a, d, g, j, m, CO2 follows the SSP2-4.5 scenario with an Equilibrium Climate Sensitivity (ECS) of 4.0 °C. Middle column b, e, h, k, n, a more intensive warming scenario where CO2 follows SSP5-8.5 with an ECS of 5.6 °C. Right column c, f, i, l, o, same as middle column but showing the anomaly relative to the FWC configuration (constant ice sheet FWF). In each panel, solid lines show the 10-member mean, and shadings show the spread between ensemble members. Insets in two bottom rows zoom-in to the period 1900–2100.

