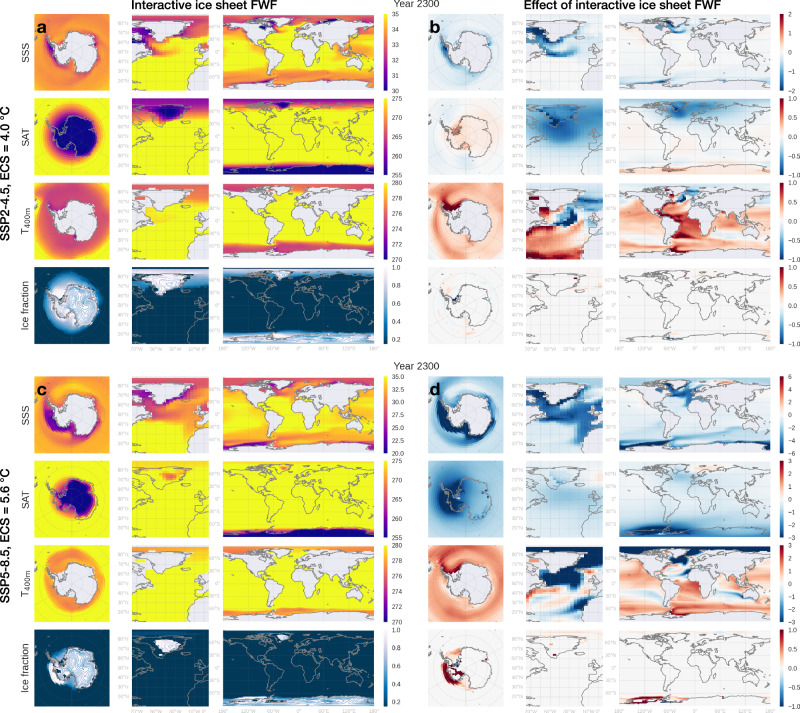
Fig. 3. Snapshots of selected variables in year 2300 simulated by the coupled ice sheet-climate model with interactive freshwater flux (FWF) from both ice sheets in two CO2 scenarios.
Rows from top to bottom in each panel show sea surface salinity (SSS), surface air temperature (SAT), 400 m depth ocean temperatures (T400 m), and ice fraction (blue contours show ice surface elevation with an interval of 200 m). a CO2 follows SSP2-4.5 with an Equilibrium Climate Sensitivity (ECS) of 4.0 °C. b Same as (a) but showing the difference between simulations with interactive FWF from both ice sheets (FWAG) and those with constant ice sheet FWF (FWC). c, d Same as (a, b) but for a more intensive warming scenario where CO2 follows SSP5-8.5 with an ECS of 5.6 °C. Yearly evolution of these maps from 1850 to 2500 under historical-SSP2-4.5 (ECS = 4.0 °C) and historical-SSP5-8.5 (ECS = 5.6 °C) are available in Supplementary Movies 1 and 2, respectively.

