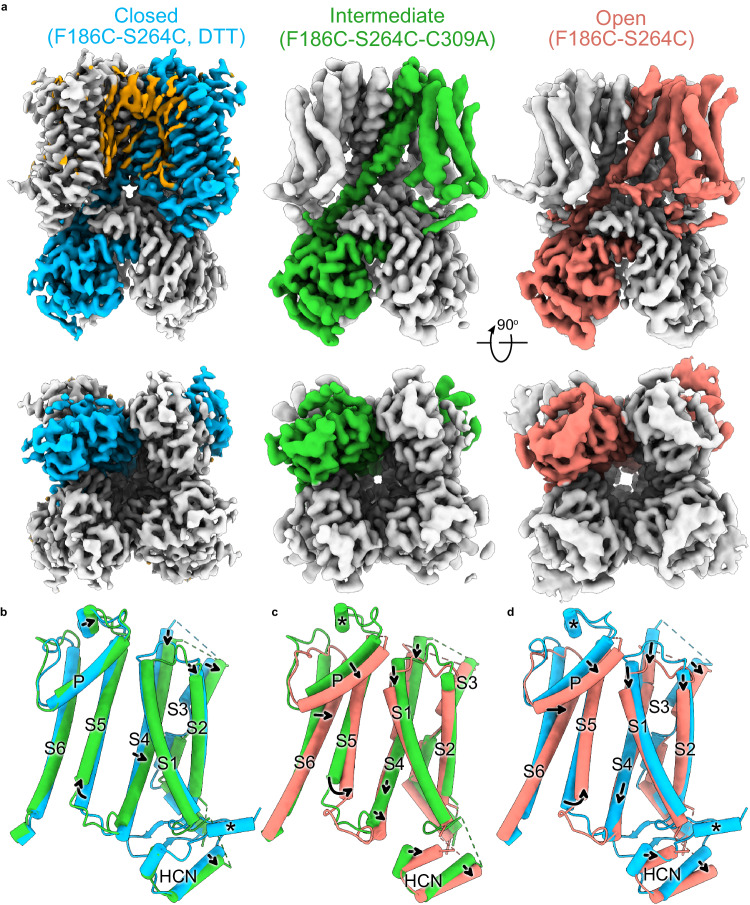
Fig. 1. Structures of the Closed, Intermediate, and Open conformations of the HCN1 channel.
a Cryo-EM density map corresponding to the three conformations. The top panel shows the side view and the lower panel shows the bottom view of the structures. One protomer in each of the three structures is colored either sky blue (Closed), lime green (Intermediate), or salmon (Open). Putative lipid densities were only observed in the Closed conformation and are colored orange. b-d, Side view of pairwise superposition of the various protomers: b the Closed and Intermediate state; c the Intermediate and Open state; d the Closed and Open state.

