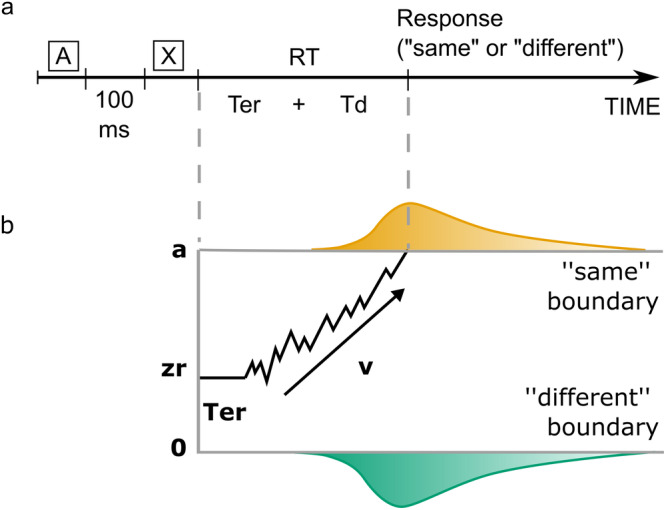
Fig. 1. Discrimination task and hierarchical drift diffusion model.

a Participants heard two pseudowords (A and X) separated by a 100 ms time interval, and had to decide whether they were identical or not. The response time (RT) is the sum of the non-decision time (Ter) and the decision processes (Td): RT = Ter + Td. b Example of the trajectory of the drift diffusion model for a “same” trial in which the correct response was delivered. Two decision boundaries (a and 0) represent the “same” and “different” decisions, respectively. The drift rate, v, represents the rate of evidence accumulation. The diffusion process starts between the two boundaries at zr (0.5a, if not biased toward one of the alternatives) and continues until it reaches one of the two boundaries. The predicted response time is the sum of the durations of the diffusion process called decision time and the one called non-decision time, which encompasses stimulus pre-processing and motor planning and execution.
