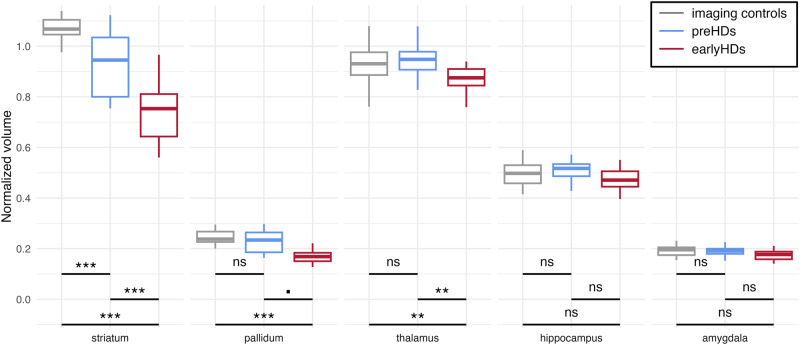
Fig. 2. Neuroanatomical differences between groups.
Boxplots of the subcortical volumes differences between groups. For representational purposes, volumes normalized to the total intracranial volume (tiv) were multiplied by 100 for all structures. In boxplots, the middle hinge corresponds to the median, the lower and upper hinges correspond respectively to the first and third quartiles. ***p < 0.001, **p < 0.01, ▪p = 0.0510, ns: non-significant. Imaging controls are represented in grey (n = 30), premanifest participants (preHDs) in blue (n = 20), and early-stage Huntington’s disease patients (earlyHDs) in red (n = 26).

