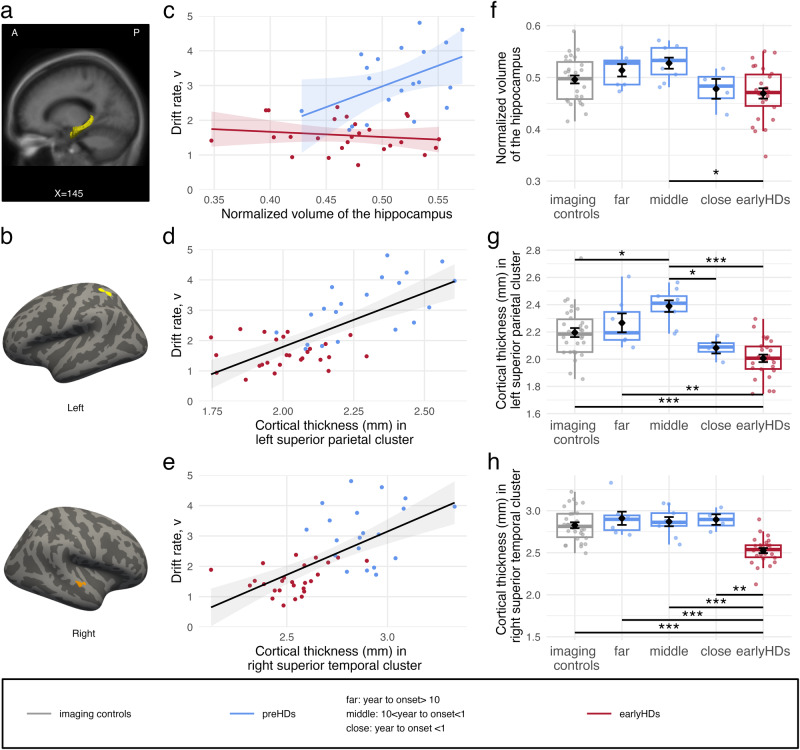
Fig. 4. Relationship between brain structure and drift rate.
a Hippocampus (yellow). X is MNI coordinate. A anterior, P posterior. b Cortical maps of significant clusters with significant relationship between the cortical thickness and the drift rate. Light grey represents gyrus and dark grey represents sulcus. Yellow: left superior parietal cluster (152.71 mm2, MNI coordinates: [–34, –55, 59]); Orange: right superior temporal cluster (112.72 mm2, MNI coordinates: [63, –16, –1]). c Relationship between the hippocampus volume normalized to the total intracranial volume (tiv) (x-axis) and the drift rate (y-axis). For representational purposes, the x-axis is multiplied by 100. d Relationship between the mean cortical thickness in the yellow cluster (panel b) (x-axis) and the drift rate (y-axis). e Relationship between the mean cortical thickness in the orange cluster (b) (x-axis) and the drift rate (y-axis). f Boxplots of the normalized hippocampus volume. g Boxplots of the mean cortical thickness in the yellow cluster. h Boxplots of the mean cortical thickness in the orange cluster. *p < 0.05, **p < 0.01, ***p < 0.001. Imaging controls are represented in grey (n = 30), premanifest participants (preHDs) in blue (n = 20, n = 7 far, n = 9 middle, n = 4 close to onset), and early-stage Huntington’s disease patients (earlyHDs) in red (n = 28). In c, d, and e, points represent individual values, whereas lines and shades around them represent the linear fit and the confidence interval, respectively.

