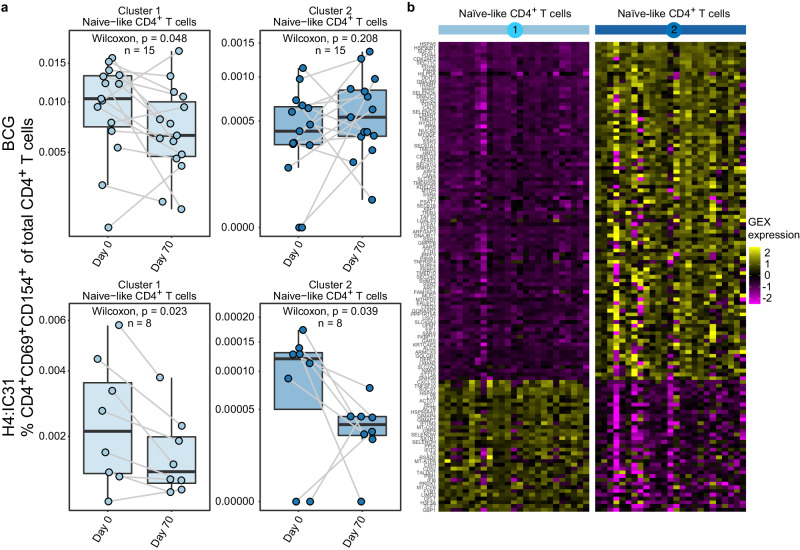
Fig. 4. TB vaccination alters antigen-reactive naïve-like cell clusters.
a Proportion of antigen-reactive T cells of total CD4+ T cells present in each naïve-like cluster, measured by CITE-Seq, that showed a significant change after vaccination in either the BCG (n = 15) or the H4:IC31 (n = 8) vaccine groups. *p < 0.05, **p < 0.01, two sided Wilcoxon Signed Rank test. Each point depicts the response in a single participant. Boxplots indicate the median response and the first and third quartiles; whiskers extend to no further than 1.5 times the inter-quartile range. b Heatmap showing average gene expression by participant (columns) of the genes (rows) that distinguish the 2 antigen-reactive naïve-like CD4+ T cell clusters from each other.

