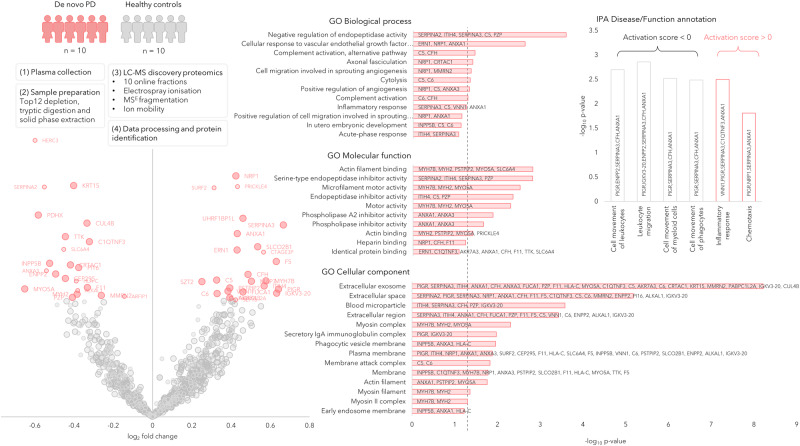
Fig. 2. Discovery phase in plasma samples of de novo PD (n = 10) and healthy controls (n = 10) represented by a Volcano plot showing the protein expression differences between PD and controls (phase 0).
The circle radii in the Volcano plot represent the identification certainty, where large radii represent proteins identified by at least two unique peptides and an identification score >15, smaller radii are given for proteins identified by two or more unique peptides or a confidence score >15. The horizontal axis shows log2 of the average fold-change and the vertical axis shows −log10 of the p values. The significantly different proteins are annotated by gene name and coloured in pink, while the non-significant proteins are coloured in grey. GO annotations for the significant proteins are shown, the dashed line represents p = 0.05. Disease and function annotations from IPA are shown, divided into annotations with a positive or negative activation score. Source data are provided as a Source Data file.

