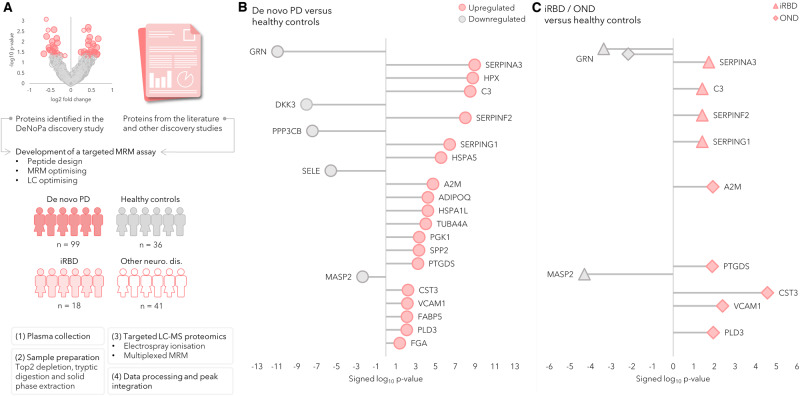
Fig. 3. Workflow and overview of results of the targeted proteomic analysis.
Workflow and overview of the results of the targeted proteomic analysis of de novo Parkinson’s disease (PD) subjects, healthy controls (HC), and the validation cohorts of other neurological disorders (OND) and isolated REM sleep behaviour disorder (iRBD). A A targeted mass spectrometric proteomic assay was developed and optimised. The assay was then applied to plasma samples from cohorts comprising de novo PD (n = 99) and HC (n = 36), and validated in patients with OND (n = 41) and prodromal subjects with iRBD (n = 18). The protein expression difference between the groups was compared using Mann–Whitney’s two-sided U-test with Benjamini–Hochberg FDR adjustment at 5%. The lollipop charts show the log10 p values, signed according to fold-changes. Pink icons represent a protein upregulated in an affected group and grey represents a protein upregulated in controls. B Significantly differentially expressed proteins in the comparison between de novo PD and healthy controls. C Significantly differentially expressed proteins between iRBD, OND and HC. Source data are provided as a Source Data file.

