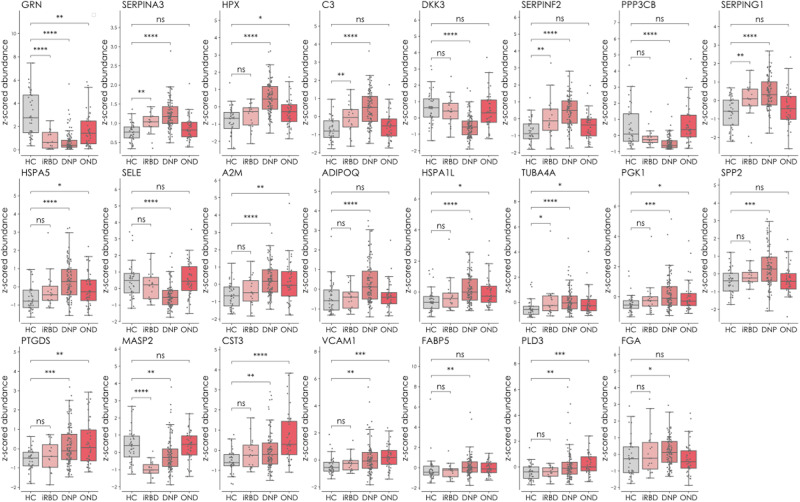
Fig. 4. Significantly different proteins between controls and the different disease groups de novo PD (DNP), iRBD and OND (phase II).
The data are displayed as Box and Whisker plots overlaid with scatter plots of the individual measurements. The whiskers show the minimum and maximum, and the boxes show the 25th percentile, the median and the 75th percentile. The protein expression difference between the groups was compared using Mann–Whitney’s two-sided U-test with Benjamini–Hochberg multiple testing correction (FDR adjustment at 5%). ns not significant, *p < 0.05, **p < 0.01, ***p < 0.001 and ****p < 0.0001. The proteins are represented by gene names. Source data are provided as a Source Data file.

