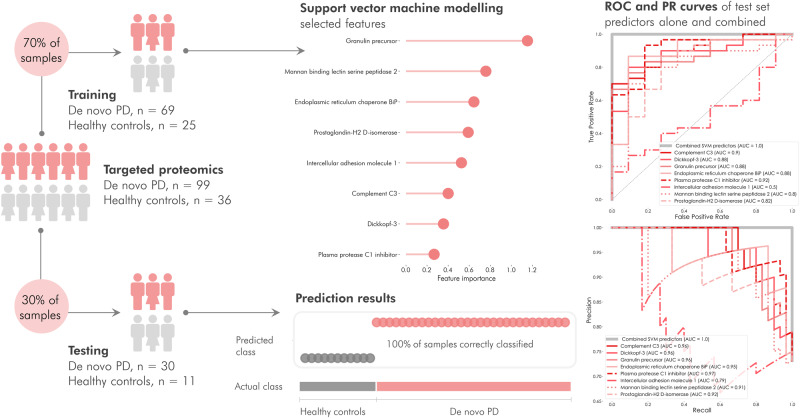
Fig. 6. Linear support vector classification of PD and control subjects. (phase I).
The model was trained on 70% of the samples to establish the most discriminating features. Applying cross-validated recursive feature elimination, the top predictors were determined as a granulin precursor, mannan-binding lectin-serine peptidase 2, endoplasmic reticulum chaperone-BiP, prostaglandin-H2 d-isomerase, intercellular adhesion molecule-1, complement C3, dickkopf-3 and plasma protease C1 inhibitor. The remaining 30% of samples were predicted in the model and resulted in 100% prediction accuracy. Receiver operating characteristics (ROC) and precision-recall (PR) curves of the individual and combined proteins in the test set demonstrated that the individual proteins achieved ROC area under the curve (AUC) values 0.53–0.92 and PR values 0.79–0.96, while the combined predictors reached an area under the curve = 1.0. Source data are provided as a Source Data file.

