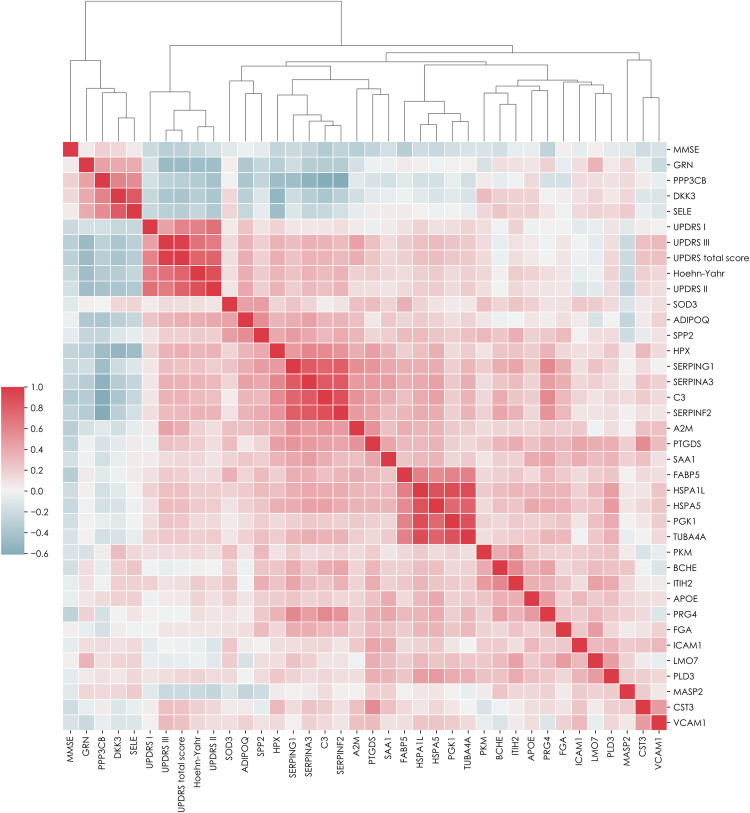
Fig. 8. Correlation and clustering heatmap of proteins measured by targeted mass spectrometry and clinical scores in controls and Parkinson’s disease subjects. (phase I).
The correlation was performed using Spearman’s procedure, and the clustering method was set to average. The clustering metric was Euclidean. The heatmap is coloured by correlation coefficient where red represents positive and blue negative correlations. The proteins are represented by gene names. Detailed information about the protein correlations can be found in Supplementary Table 3. De novo Parkinson’s disease (n = 99) and healthy controls (n = 36). MMSE mini-mental state examination, UPDRS unified Parkinson’s disease rating Scale. Source data are provided as a Source Data file.

