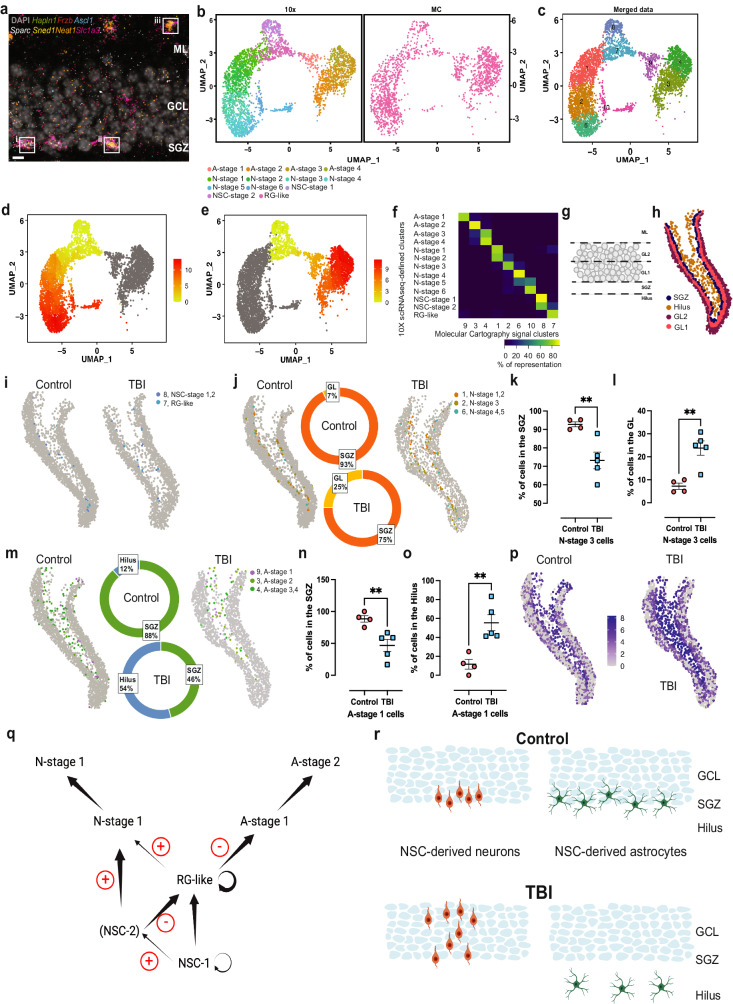
Fig. 5. TBI induces changes in the location of specific cell populations in the dentate gyrus.
Micrograph representative of three independent experiments showing RNAscope visualization of marker genes for A-stage 4 (a, inset iii), A-stage 2 (a, inset ii) and A-stage 1 (a, inset i) cells (individual marker signals shown in Supplementary Fig. 7). ML molecular layer, GCL granule cell layer, SGZ subgranular zone; scale bar, 5 µm. UMAP-based representation of the individual 10X and Molecular Cartography (MC) datasets. scRNA-seq-derived (left) and MC-derived data (right) share a similar distribution within UMAP space. Colors in the 10X dataset indicate neuronal and astrocytic cell lineages (b). UMAP-based representation of the combined 10X-MC dataset (merged data), with colors indicating the ten distinct clusters identified (c). UMAP-based representation of pseudotime for neuronal (d) and astrocytic (e) lineages using the combined 10X-MC dataset. Color bars: relative pseudotime distance from the root population (yellow: minimum, red: maximum). Correlation matrix showing the relative overlap in gene expression data between cell populations identified by scRNA-seq (10X scRNA-seq-defined clusters) and MC (Molecular Cartography signal clusters) (f). Color bar: % of genes in a scRNA-seq cluster present in a MC cluster. DG subdivisions used to compare the location of MC clusters, Hilus, subgranular zone (SGZ), inner granule cell layer (GL1), outer granule cell layer (GL2). ML is indicated as reference (g). Spatial mapping for an example Control DG section (h). Spatial mapping of NSC populations in Control and TBI groups in the DG. Colored dots indicate the location of single-cell populations indicated in the legend (i). Spatial mapping of NSC-derived neuronal cells in Control and TBI groups in the DG. Colored dots indicate the location of single-cell populations indicated in the legend. Pie charts: % localization of N-stage 3 cells to the SGZ (orange) or the GL (yellow) (j). Dot plots showing quantification of N-stage 3 cells in the SGZ (k) or the GL (l), n = 4 Control, n = 5 TBI. Data are presented as mean values +/− SEM, **P = 0.0075 (k), P = 0.0030 (l), two-tailed unpaired t test. Spatial mapping of NSC-derived astrocytic populations in Control and TBI groups. Colored dots indicate the location of single-cell populations indicated in the legend. Pie charts: % localization of astrocytic A-stage 1 cells to the SGZ (green) or the Hilus (blue) (m). Dot plots showing the quantification of A-stage 1 cells in the SGZ (n) or the Hilus (o) n = 4 Control, n = 5 TBI. Data are presented as mean values +/− SEM, **P = 0.0088 (n), P = 0.0043 (o), two-tailed unpaired t test. Spatial mapping of Gfap+ astrocytes in the DG from Control and TBI animals (p); dots indicate the location of single cells, with color encoding the relative intensity of Gfap expression. Spatial representations in (j, m) are representative examples of hippocampal slices analyzed to generate the data in (k, l, n, o). Summary of cell transitions predicted by RNA velocity in the Control and TBI groups. Black arrows indicate the most probable transitions of NSCs and NSC-derived cells along neuronal and astrocytic lineages in uninjured AHN; arrow thickness indicates transition probability. Red +: transition promoted by TBI; Red −: transition inhibited by TBI. Circular arrows: cell populations with predicted self-renewal potential (q). Representations of GCL/SGZ/Hilus areas in the DG indicating the location of NSC-derived neuronal or astrocytic cells determined using MC spatial transcriptomics in both Control and TBI (r). Source data are provided as a Source Data file.

