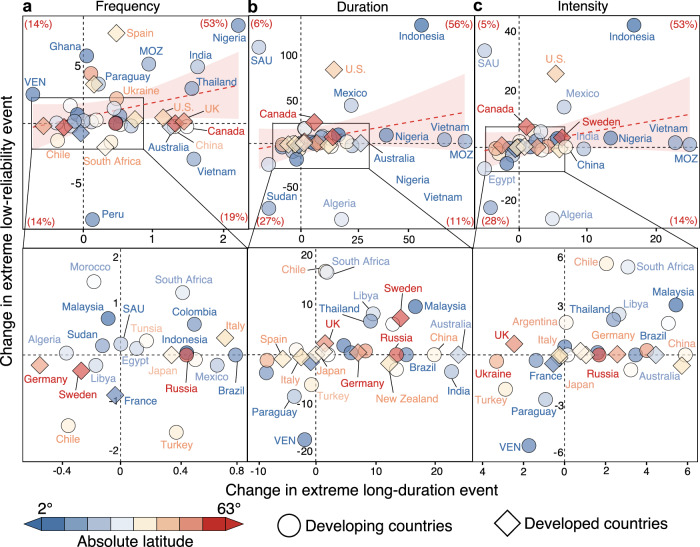
Fig. 4. Relationship of changes in extreme long-duration and low-reliability events at the national scale.
Changes in frequency (a), duration (b), and intensity (c) of extreme long-duration and low-reliability events for 42 major countries between 1980–2000 and 2001–2022. Red digits represent the proportion of countries that fall in the quadrant. Dashed red lines with shallow red shading are linear fittings between the two types of events and their 95% confidence intervals. SAU, MOZ and VEN denote Saudi Arabia, Mozambique, and Venezuela, respectively. Source data are provided as a Source Data file.

