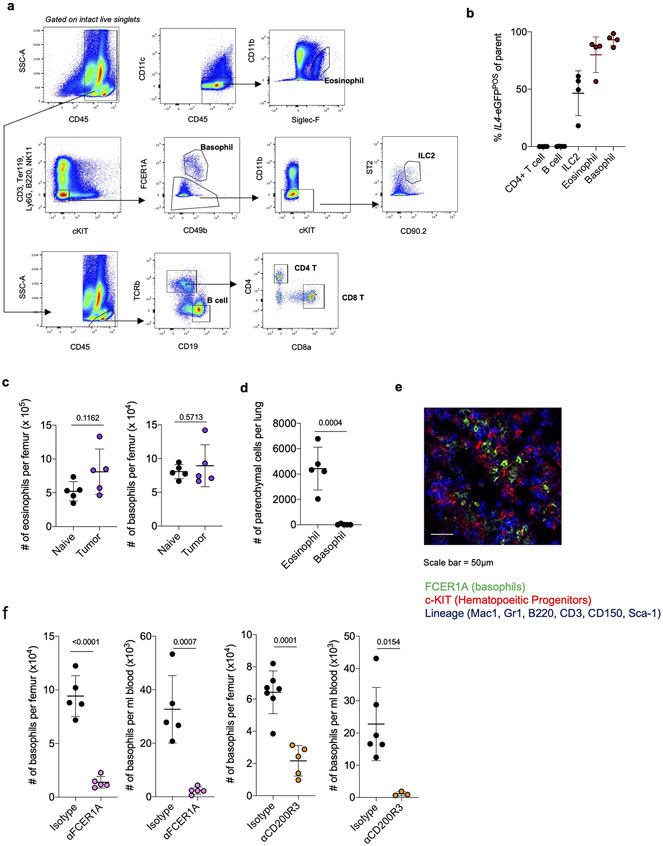
Extended Data Figure 6. Dynamics of Type 2 granulocytes in BM.
(a) Flow cytometry strategy for BM populations analyzed in Fig. 3a. (b) Percentage of IL4-eGFPPOS cells among indicated BM populations in WT KP tumor-bearing mice. n=5 mice. Representative of two independent experiments. (c) Number of BM eosinophils and basophils in naïve and tumor-bearing WT mice. n=5 mice per group. Representative of two independent experiments. (d) Number of CD45-IV negative eosinophils and basophils in lungs of tumor-bearing WT mice. n=5 mice per group. Representative of two independent experiments. (e) Representative microscopy of BM of tumor-bearing mice showing colocalization of basophils (green) with hematopoietic progenitors (red) (representative of 3 mice). (f) Basophil depletion efficiency in indicated organs after using αFCER1A (left) or αCD200R3 (right) depletion strategies n=5 isotype and 5 αFCER1A-treated mice; 7 isotype and 5 αCD200R3-treated mice for BM; 6 isotype and 3 αCD200R3-treated mice for blood. Unpaired two-tailed Student’s t-test. Data are mean ± s.d.

