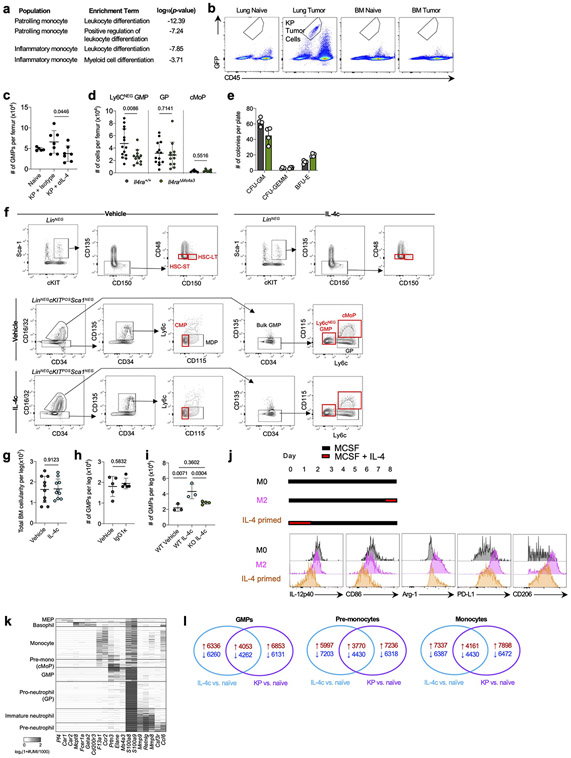
Extended Data Figure 5. IL-4 controls myelopoiesis.
(a) Top pathways enriched among DEGs from indicated lung monocyte populations in tumor-bearing Il4ra+/+ and Il4raΔMs4a3 mice. (b) Flow cytometry plots showing CD45NEGGFPPOS cells in lung and BM of mice bearing GFP-expressing KP tumors. (c) Number of GMPs per femur of naïve mice or KP tumor-bearing mice treated with isotype or αIL-4 antibodies. n=5, 7, 7 mice per group. Representative of two independent experiments. (d) Number of Ly6cNEG GMP, GP, and cMoP progenitors in BM of KP tumor-bearing Il4ra+/+ and Il4raΔMs4a3 mice. n=14 Il4ra+/+ and 12 Il4raΔMs4a3 mice for Ly6cNEG GMPs and GPs and 6 Il4ra+/+ and 7 Il4raΔMs4a3 mice for cMoPs. Pooled from two independent experiments. (e) Methocult differentiation assay of Il4ra+/+ and Il4raΔMs4a3 BM. n=4 technical replicates per condition. Representative of two independent experiments. (f) Representative gating strategy for BM progenitor populations in vehicle and IL-4c treated mice. (g) Total BM cellularity from legs of WT mice treated with vehicle or IL-4c (n=10 mice per group). Pooled from two independent experiments. (h) Number of GMPs per leg of mice treated with vehicle or IgG1κ antibodies. n=5 mice per group. One experiment (i) Number of GMP per leg of Il4ra+/+ (WT) or Il4raΔMs4a3 (KO) mice treated with vehicle or IL-4c. n=3, 3, 4 mice per group. One experiment. (j) Expression of macrophage polarization markers in BMDMs differentiated under indicated conditions. Representative of two independent experiments. (k) scRNA-seq of BM myeloid cells and myeloid progenitors from naïve, IL-4c treated, and KP tumor-bearing mice. Heatmap shows indicated clusters (y axis) and cluster-defining genes (x axis). (l) Total number of genes up or downregulated in each condition relative to naïve in indicated BM scRNA-seq clusters. One experiment. Fisher’s Exact Test (a), Unpaired two-tailed Student’s t-test (c,d,g,h), or One-way ANOVA with post hoc Tukey’s test (i). Data are mean ± s.d. Lin = CD3e, B220, Ter-119, CD11b, Ly6g, NK1.1.

