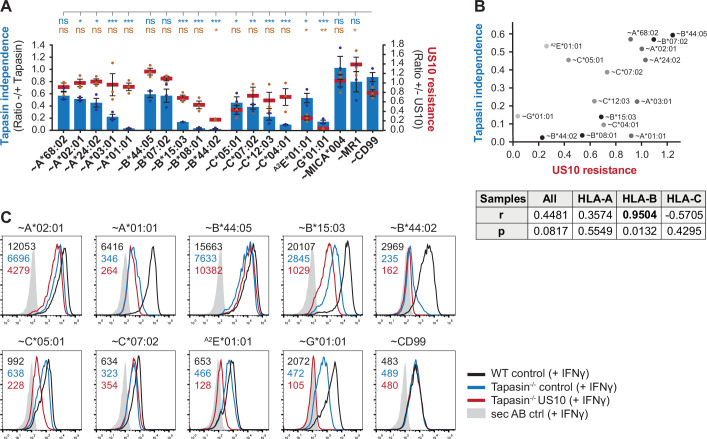
Figure 3. Higher tapasin dependency in HLA-B correlates with increased sensitivity to US10.
(A) Wild-type or tapasin knockout HeLa cells were transiently co-transfected as indicated and treated with IFNγ overnight. Cell surface expression of the HA-tagged molecules or non-tagged HLA-A2E*01:01 was determined (representative histograms in Figure 3—figure supplement 1B) as in Figure 1A. US10 resistance was calculated as the ratio of the median fluorescence intensity (MFI) of US10-expressing cells compared to control cells (red lines). Tapasin independence was calculated as the ratio of the MFI of tapasin knockout cells compared to wild-type cells (blue bars). Dots represent individual values and bars mean values ± SEM from three independent experiments (biological replicates). Significance compared to the HA-CD99 control was calculated using one-way ANOVA followed by Dunnett’s multiple comparison test. (B) Two-tailed correlation analysis of the results from (A). (C) Flow cytometry analysis performed as in (A) including US10 in tapasin knockout cells. Representative histograms from one of three independent experiments (biological replicates) are shown.


