. 2024 Jun 20;13:e85560. doi: 10.7554/eLife.85560

Figure 6. Downregulation of overlapping US10 and US11 transcripts in human cytomegalovirus (HCMV)-infected cells rescues human leucocyte antigen class I (HLA-I) interaction with the peptide loading complex (PLC).

(A) MRC-5 fibroblasts were nucleofected with US10-specific or non-targeting siRNA 24 hr prior to mock treatment or infection with HCMV ΔUS2-6 mutant BAC2 at an MOI (multiplicity of infection) of 5. At 24 hr p.i., RNA was isolated. Subsequently, cDNA was generated and analyzed by qPCR. The binding sites for the used primers are depicted in Figure 6—figure supplement 2. Expression of US10 and US11 is shown compared to expression of actin. (B) HLA-G-expressing BJ-5ta fibroblasts were treated with siRNA and infected as in (A). At 48 hr post-infection, cells were metabolically labeled for 2 hr. Digitonin cell lysates were prepared, and immunoprecipitations were performed as indicated (lanes 1–3). In parallel, immunoprecipitations were performed with HeLa cells transfected with US10 or US11 expression plasmids, lanes 4–7 (Figure 6—source data 1). (C) MRC-5 fibroblasts were nucleofected with US10-specific or non-targeting siRNA 24 hr prior to mock treatment or infection with the HCMV ΔUS2-6 mutants BAC2 or HB5 at an MOI of 7. Proteins were metabolically labeled at 24 h p.i. for 2 hr, and immunoprecipitations using anti-ERp57 or W6/32 were performed. All samples were treated by EndoH (Figure 6—source data 2). Asterisk: strongly increased HLA-I HC when applying US10 siRNA. One of two independent experiments (biological replicates) is shown. (D) BAC2-infected MRC-5 fibroblasts were treated as in (C), and HLA-I-specific immunoprecipitations were performed as indicated. All samples were EndoH-treated prior to separation by SDS-PAGE (Figure 6—source data 2).

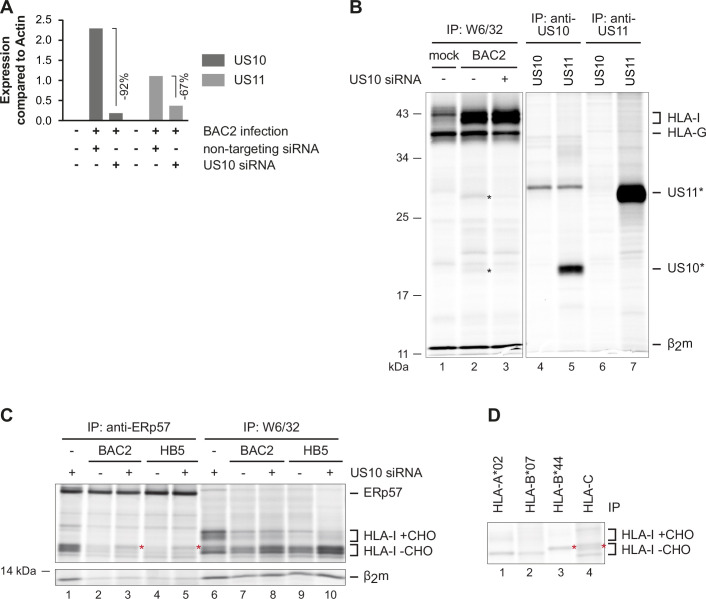
Figure 6—source data 1. Immunoprecipitation in Figure 6B.
Figure 6—source data 2. Immunoprecipitations in Figure 6C and D.

Figure 6.

Figure 6—figure supplement 1. Overlapping US10 and US11 transcripts in human cytomegalovirus (HCMV)-infected cells.

Figure 6—figure supplement 1.

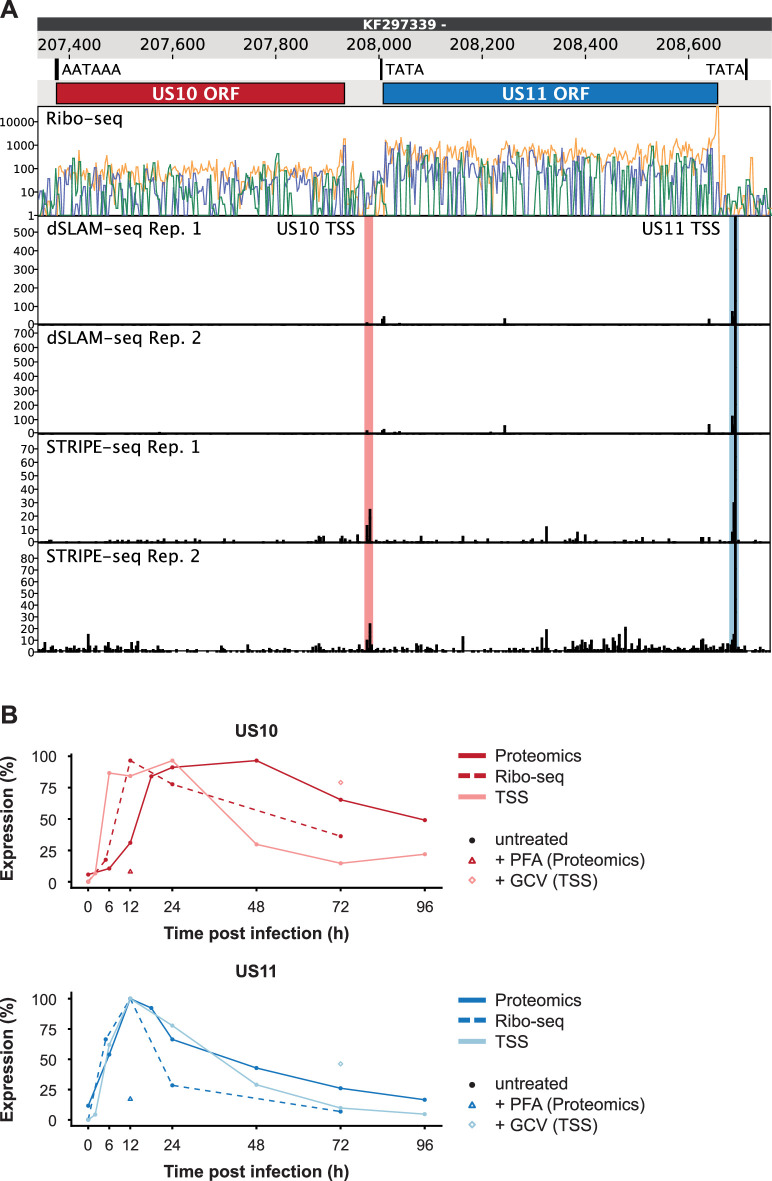
(A) Genome browser showing the US10/11 locus. The tracks show (from top to bottom) the genomic position, identified sequence motifs, the known open-reading frames (ORFs) encoding US10 and US11, the Ribo-seq signal mapped to the three possible reading frames (orange, green, blue), and the 5’ end read counts for TSS profiling data. Identified US10 and US11 transcription start sites (TSS) are indicated. (B) Time-course plots depicting the temporal expression dynamics of US10 (top) and US11 (bottom). TSS profiling, Ribo-seq, and proteomics data were scaled to the corresponding maximal value. Samples that were treated with genome replication inhibitors (PFA or GCV) are indicated.
Figure 6—figure supplement 1—source data 1. Western blots in Figure 6—figure supplement 2.
Figure 6—figure supplement 1—source data 2. Immunoprecipitation in Figure 6—figure supplement 2.
Figure 6—figure supplement 2. Downregulation of overlapping US10 and US11 transcripts in human cytomegalovirus (HCMV)-infected cells rescues human leucocyte antigen class I (HLA-I) interaction with the peptide loading complex (PLC).

Figure 6—figure supplement 2.

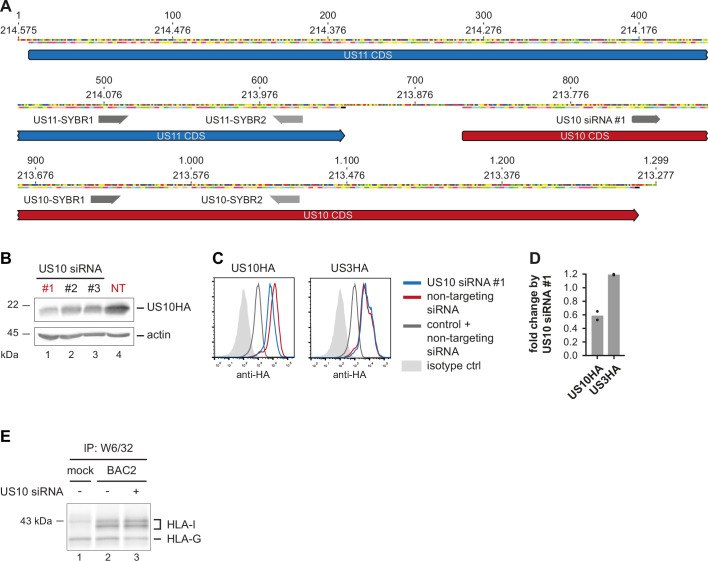
(A) Depiction of the coding sequences (CDS) for US11 and US10 and binding sites for the primers used for RT-PCR in Figure 6A and of US10-targeting siRNA #1. (B) Stable HeLa-US10HA cells were transfected with three different siRNA targeting US10 (#1–3) or with non-targeting (NT) siRNA. Whole-cell lysates were prepared for western blot analysis using anti-HA antibodies (Figure 6—figure supplement 2—source data 1). US10-targeting siRNA #1 was used for all subsequent experiments. (C, D) MRC-5 fibroblasts were nucleofected with US10HA, US3HA, or a control plasmid together with US10- or non-targeting siRNA. At 24 hr post-nucleofection, an intracellular anti-HA staining was analyzed by flow cytometry. Fold change by US10 siRNA is depicted in (E) Short exposure of HLA-I HCs from the immunoprecipitation experiment shown in Figure 6B (Figure 6—figure supplement 1—source data 2).
Figure 6—figure supplement 2—source data 1. Uncropped blots from Figure 6—figure supplement 2B.
Figure 6—figure supplement 2—source data 2. Uncropped version of Figure 6—figure supplement 2E.