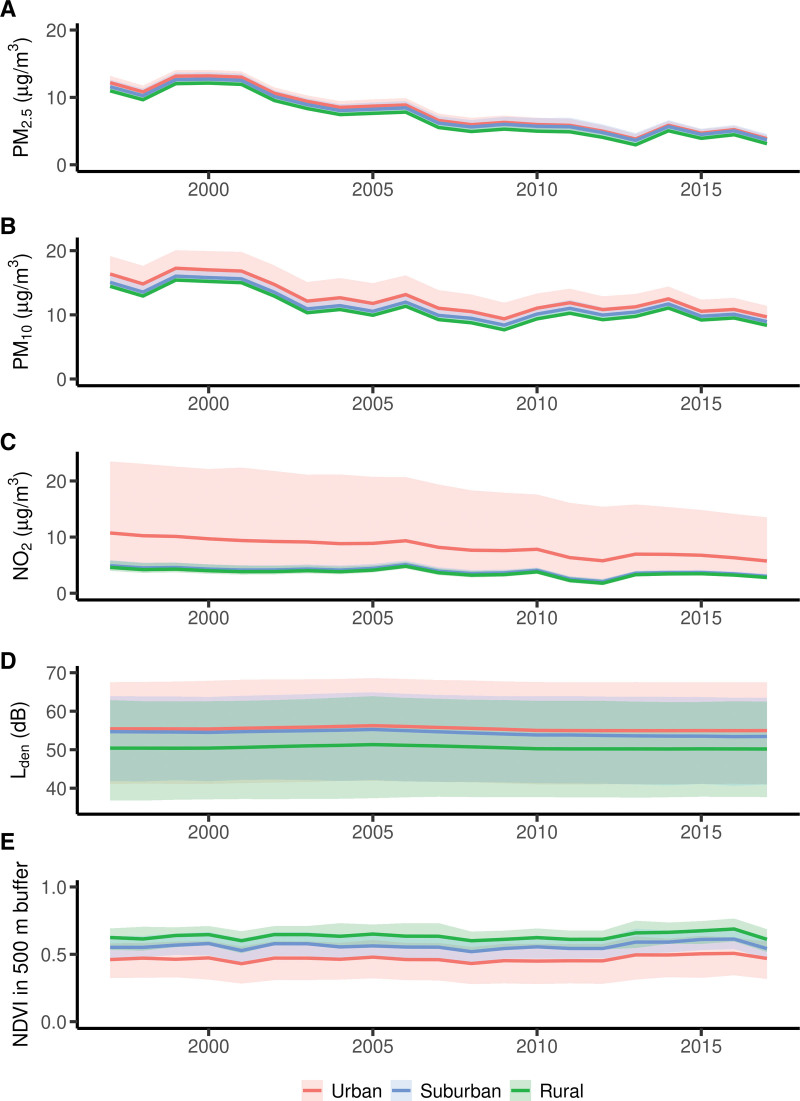
Figure 2.
Time-trends of environmental exposures by residential urbanization type. Annual average and 5th and 95th percentile of the exposure to (A) PM2.5, (B) PM10, (C) NO2, (D) road traffic noise, and (E) greenness (500 m radius buffer around the residents) among study participants of the Swedish Mammography Cohort (SMC) residing in Uppsala County, Sweden, grouped by urbanization type (based on degree of urbanization by the demographic statistical areas [DeSO]).

