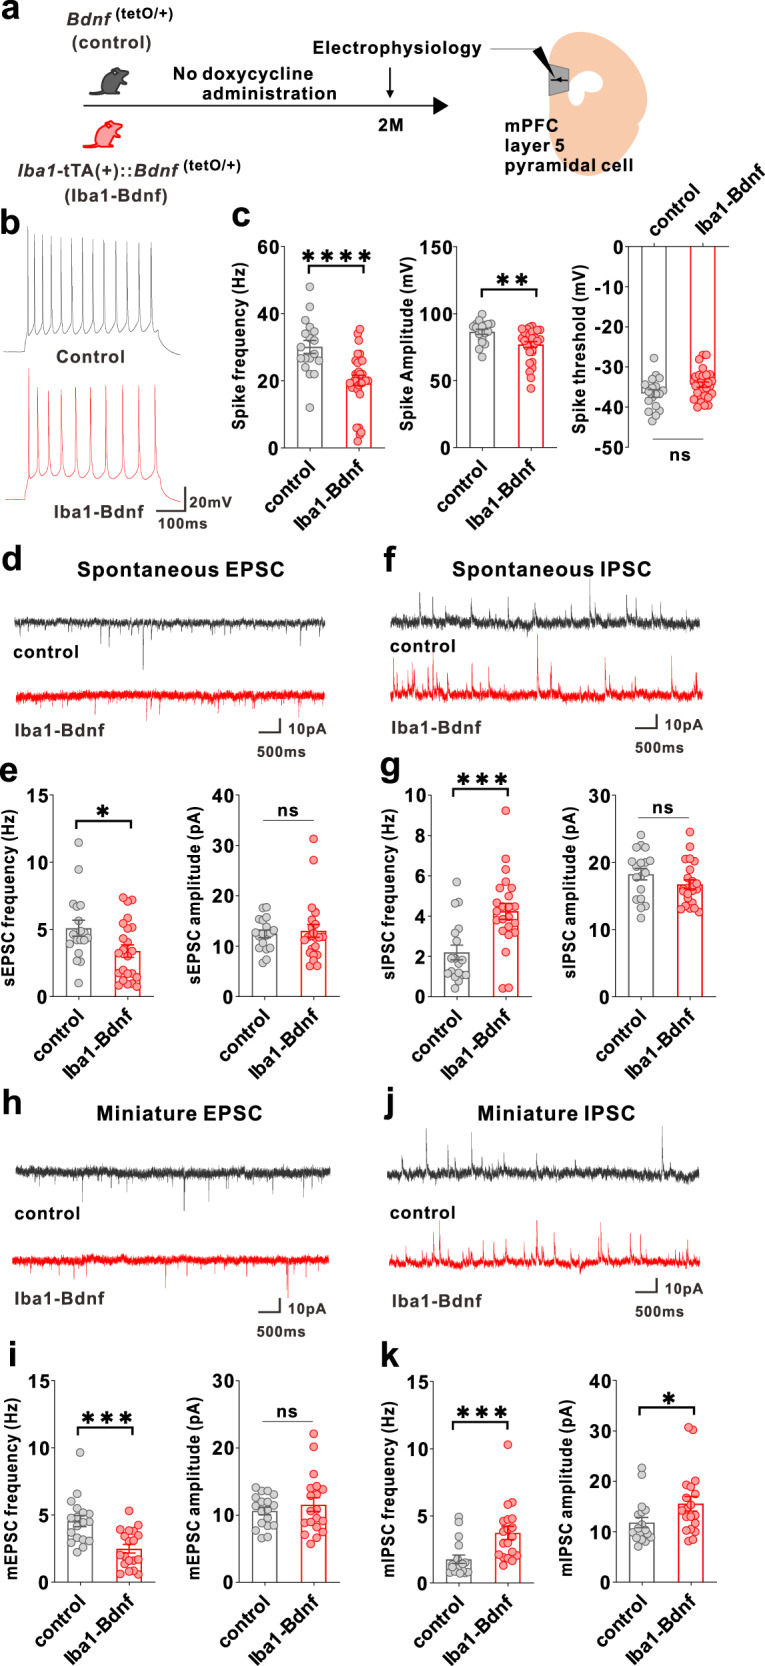
Fig. 3. MG-BDNF overexpression affects the inhibitory synaptic inputs to mPFC pyramidal cells and the excitability of such cells.

a Electrophysiological analysis of mPFC layer V pyramidal cells in adulthood without doxycycline administration. The experiments were started at P62. b Representative traces recorded from mPFC pyramidal cells at 200-pA injection. c Iba1-tTA(+)::Bdnf(tetO/+) mice had lower spike frequency (U = 93.50, p < 0.0001, Mann–Whitney U test) (left) and amplitude (U = 131, p = 0.0026, Mann–Whitney U test) (middle) than Bdnf(tetO/+) mice at 200-pA injection. No significant differences existed in spike threshold (t(46) = 1.997, p = 0.0518, unpaired two-tailed Student’s t test) (right). (n = 18 cells from three biologically independent Bdnf(tetO/+) mice, n = 30 cells from four biologically independent Iba1-tTA(+)::Bdnf(tetO/+) mice). d Representative traces of spontaneous excitatory postsynaptic currents (sEPSCs). e (Left) The Iba1-tTA(+)::Bdnf(tetO/+) mice had lower sEPSC frequency than Bdnf(tetO/+) mice (U = 130, p = 0.0436, Mann–Whitney U test). (Right) No significant difference existed in sEPSC amplitude (U = 185, p = 0.5761, Mann–Whitney U test). f Representative traces of spontaneous inhibitory postsynaptic currents (IPSCs). g (Left) Iba1-tTA(+)::Bdnf(tetO/+) mice showed increased sIPSC frequency compared with Bdnf(tetO/+) mice (U = 85, p = 0.0010, Mann–Whitney U test). (Right) There was no significant difference in sIPSC amplitude (t(39) = 1.440, p = 0.1579, unpaired two-tailed Student’s t test). e, g n = 18 cells from three biologically independent Bdnf(tetO/+) mice, n = 23 cells from four biologically independent Iba1-tTA(+)::Bdnf(tetO/+) mice. h Representative traces of miniature EPSCs (mEPSCs). i (Left) Iba1-tTA(+)::Bdnf(tetO/+) mice had lower mEPSC frequency than Bdnf(tetO/+) mice. (t(35) = 3.949, p = 0.0004, unpaired two-tailed Student’s t test). (Right) There was no significant difference in mEPSC amplitude (U = 158, p = 0.7074, Mann–Whitney U test). j Representative traces of miniature IPSCs (mIPSCs). (k) The Iba1-tTA(+)::Bdnf(tetO/+) mice had increased mIPSC frequency (U = 53, p = 0.0002, Mann–Whitney U test) (left) and amplitude (U = 101, p = 0.0335, Mann–Whitney U test) (right) than the Bdnf(tetI/+) mice. i, k n = 18 cells from three biologically independent Bdnf(tetO/+) mice, n = 19 cells from three biologically independent Iba1-tTA(+)::Bdnf(tetO/+) mice. *p < 0.05, **p < 0.01, ***p < 0.001, ****p < 0.0001. Data are presented as the mean ± SEM. 2 M: two months of age, control: Bdnf(tetO/+) mice, Iba1-Bdnf: Iba1-tTA(+)::Bdnf(tetO/+) mice.
