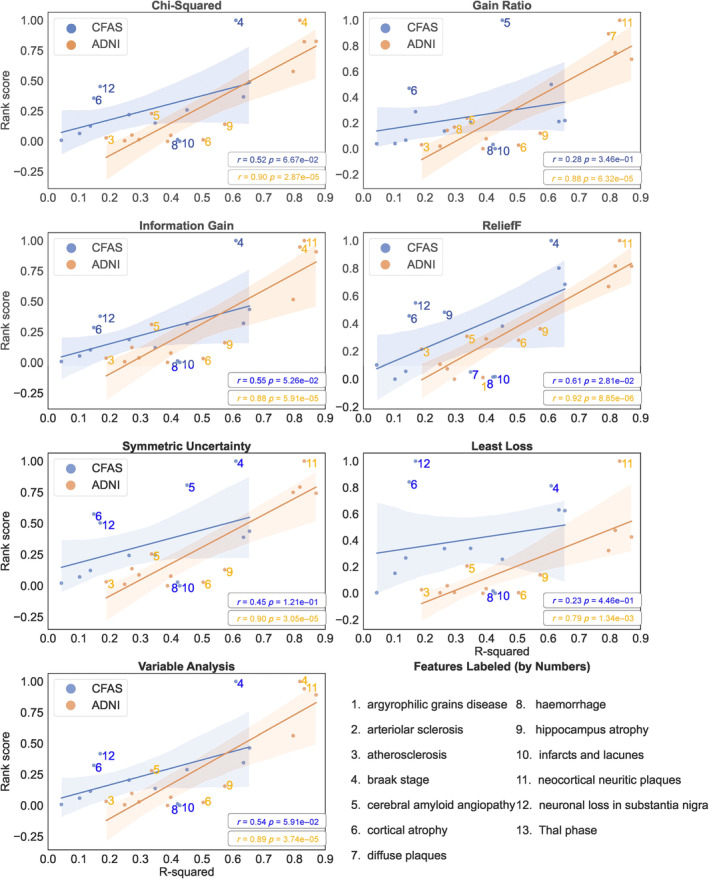
FIGURE 6.

The relationship between feature–feature correlation and feature ranking obtained from filter methods using ADNI‐pathology and CFAS datasets. Best fit linear models with confidence intervals (shading) describe the relationship. Pearson's correlation coefficients (r) and p‐values (p) are reported.
