FIGURE 2.

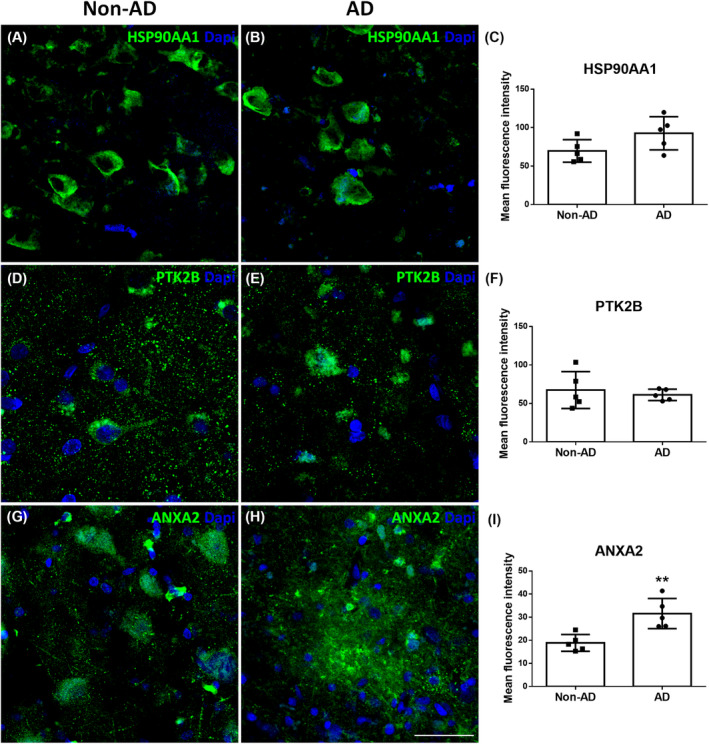
Validation of proteomic results through immunofluorescence: HSP90AA1, PTK2B, and ANXA2. Coronal sections of the human EC stained for HSP90AA1 in non‐AD (A) and AD (B) cases, PTK2B in non‐AD (D) and AD (E) cases and ANXA2 in non‐AD (G) and AD (H) cases. Quantification from confocal fluorescence microscopy images of HSP90AA1 (C), PTK2B (F) and ANXA2 (I). The graphs show the mean ± SD, **p value < 0.01. Scale bar = 40 μm for (A,B) and (G,H) and 25 μm for (D,E). AD, Alzheimer's disease; EC, entorhinal cortex.
