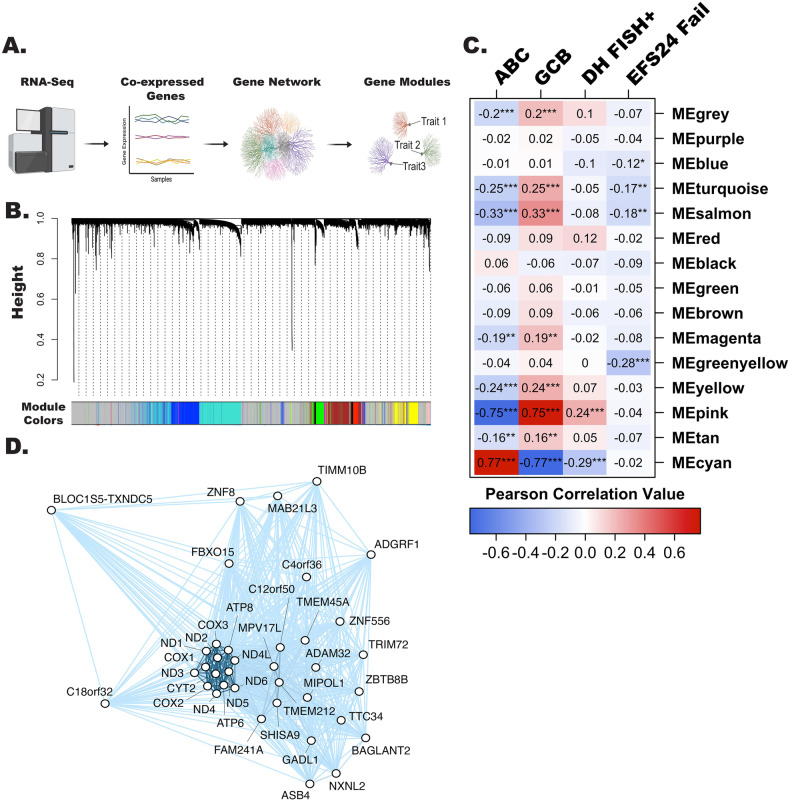
Fig. 2. WGCNA analysis identifies biological modules associated with DLBCL clinical traits.
A Schematic representation of WGCNA analysis workflow, created with BioRender.com. B Cluster dendrogram showing the 15 identified modules defined by color. The gray module consists of genes that could not be assigned to a co-expression module. C Correlation of individual WGCNA modules with selected traits (COO of ABC or GCB, n = 279, DH-FISH n = 252, and EFS24, n = 321) was performed using Pearson correlation, *P < 0.05, **P < 0.001 and ***P < 0.0001. D Correlation network representation of greenyellow module genes (n = 37) analyzed using the igraph R package.

